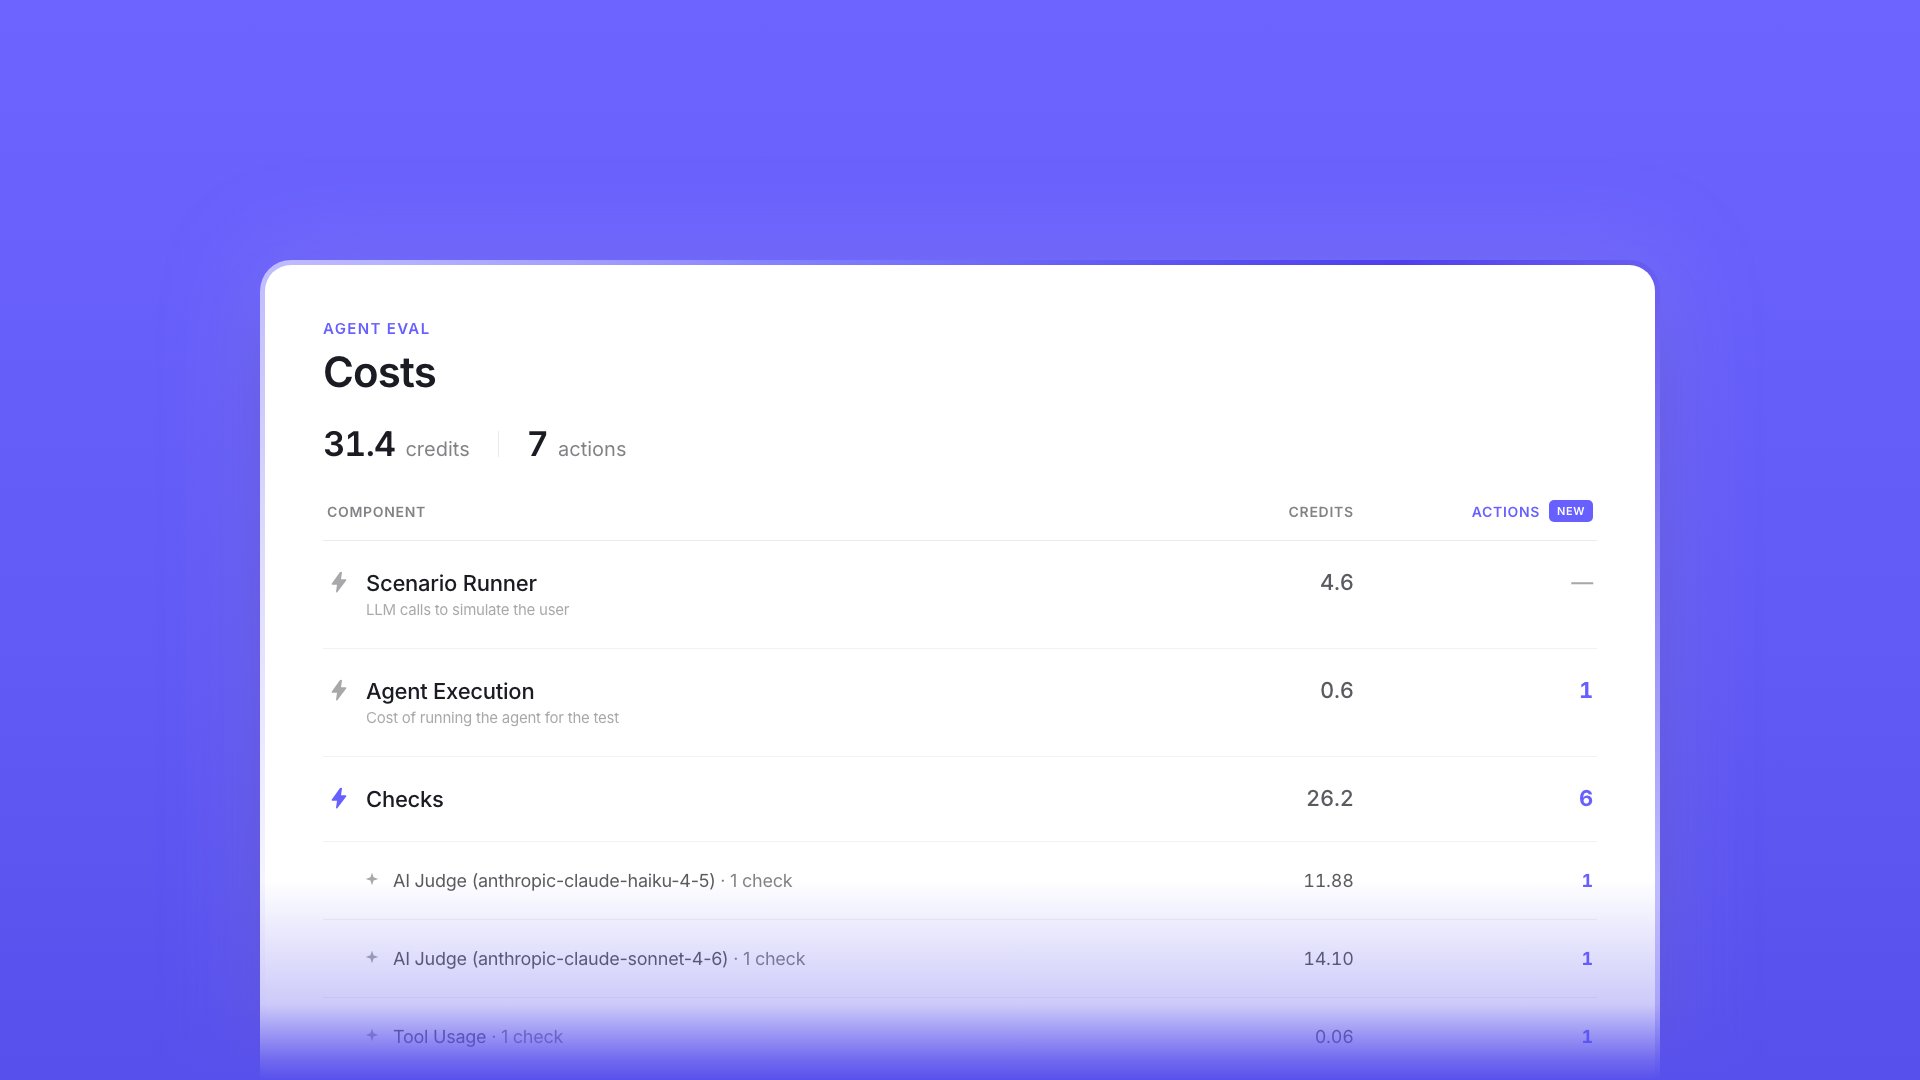
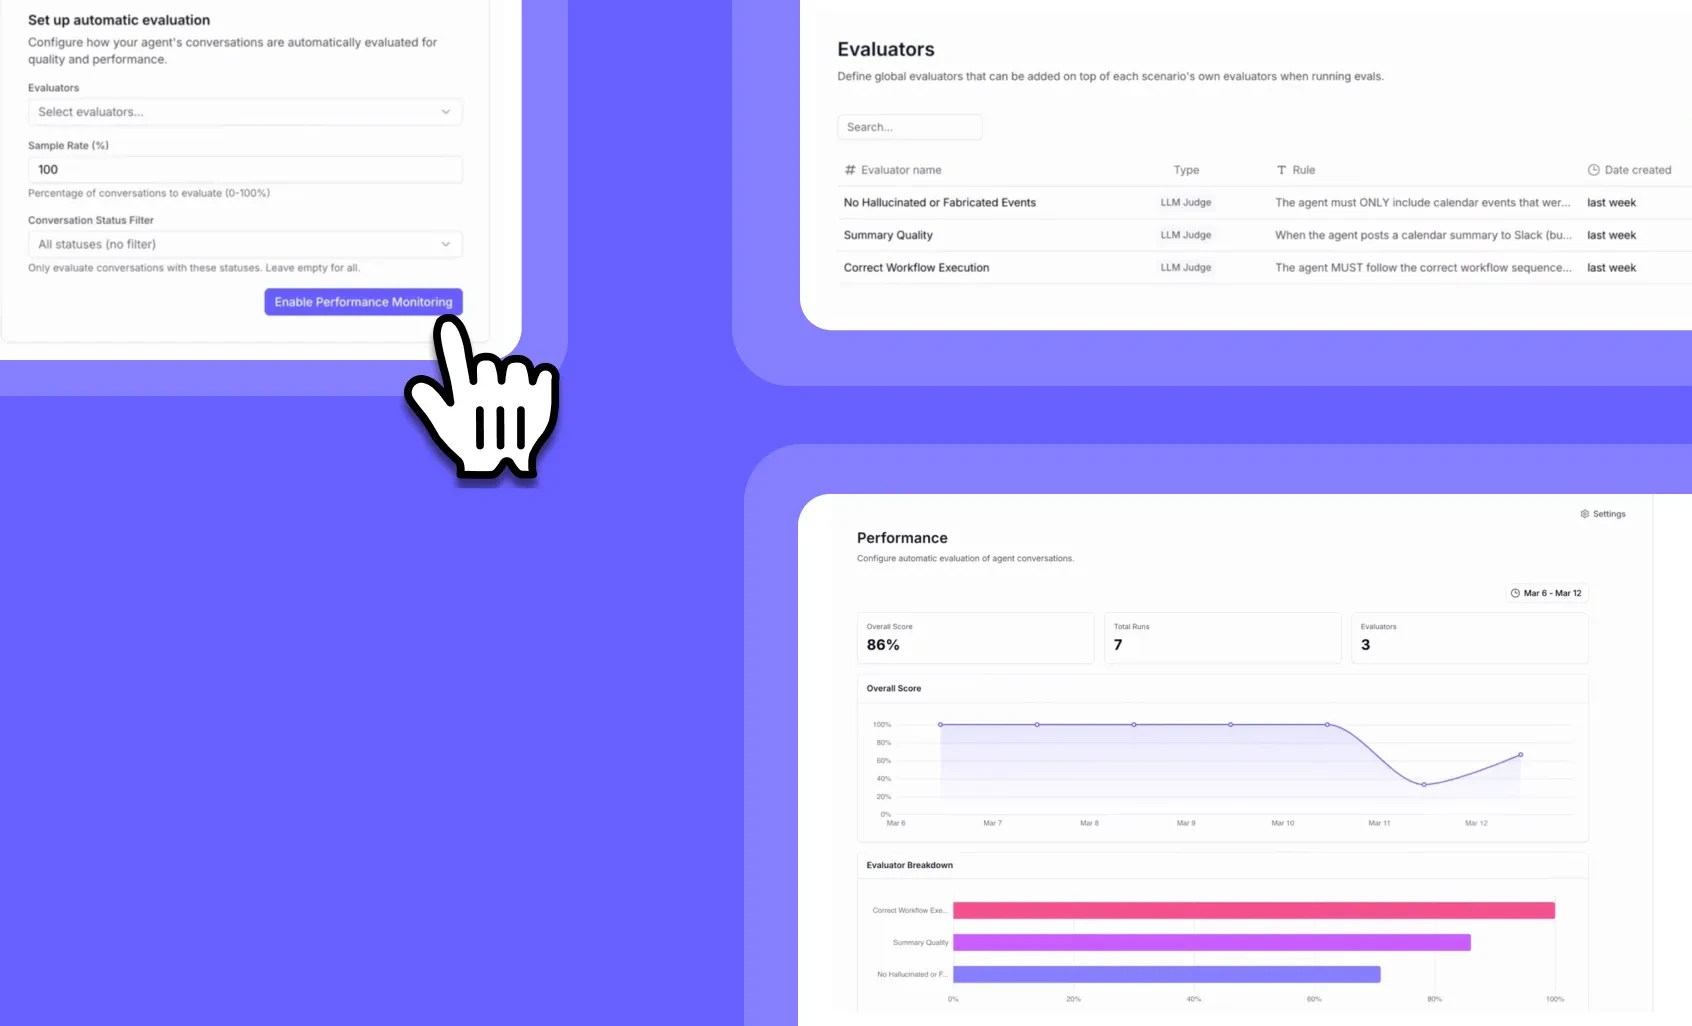
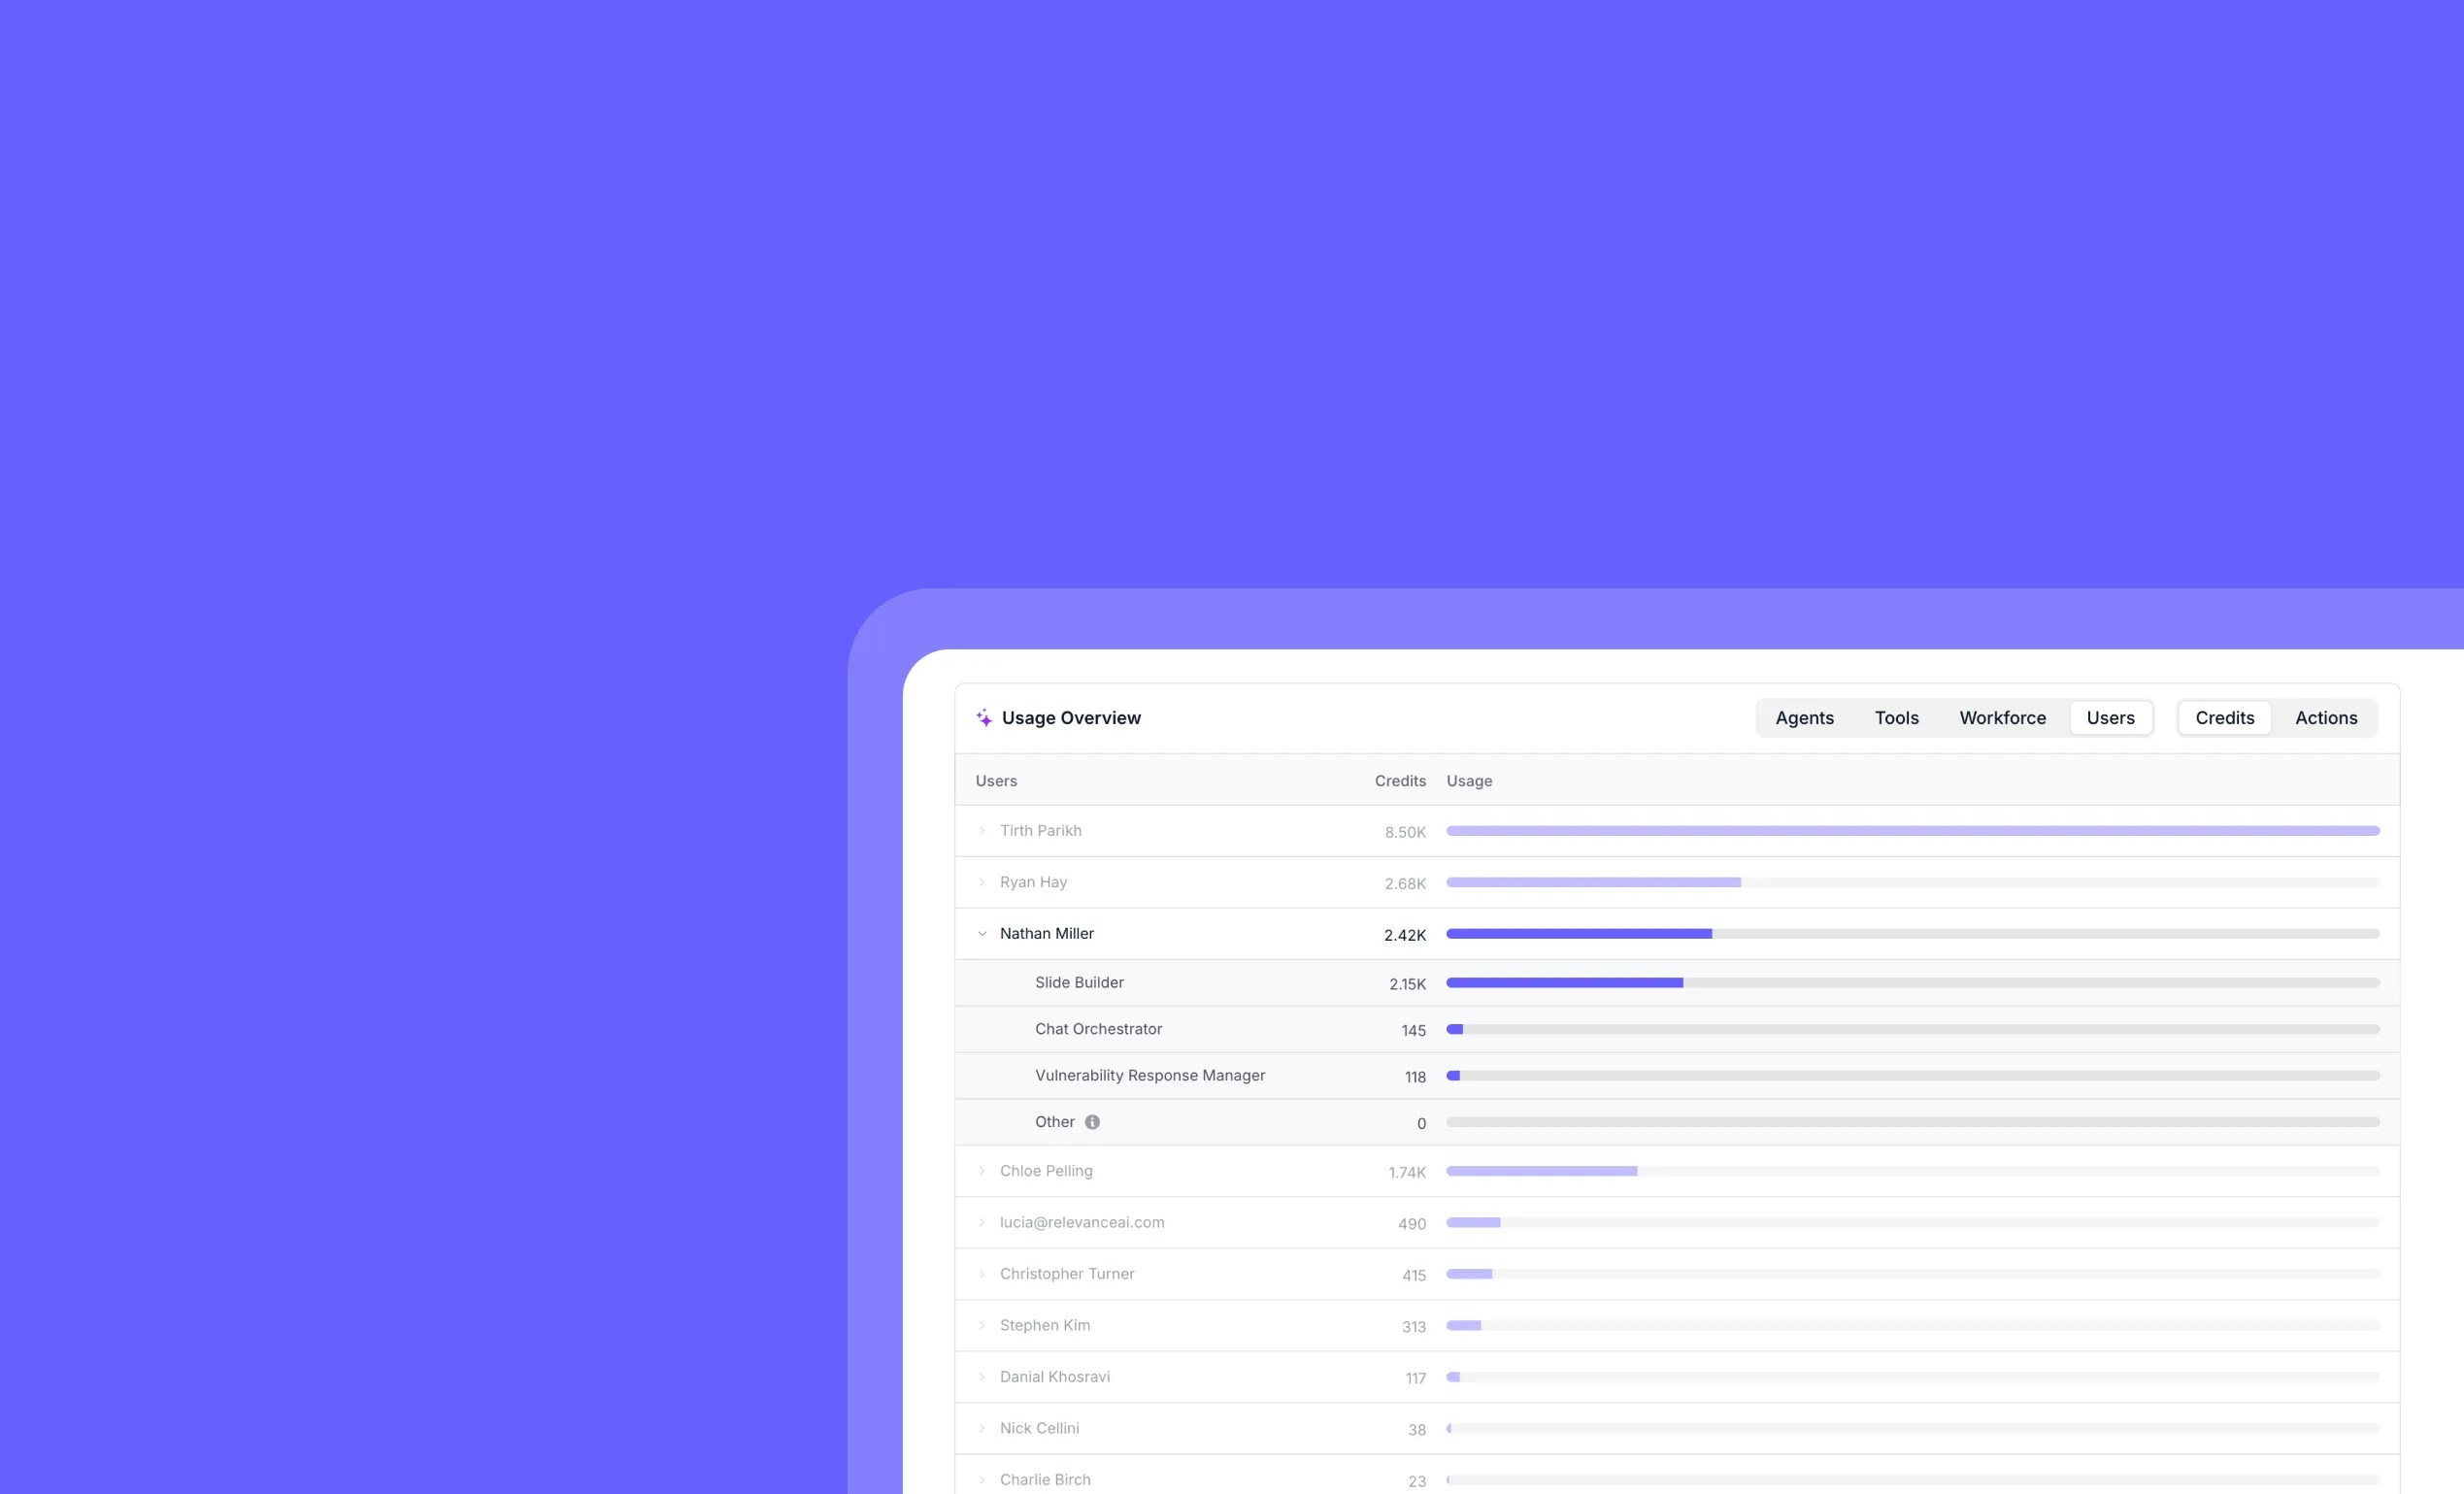
Eval cost breakdowns and Workforce evaluations
Gemini 3.5 Flash now available

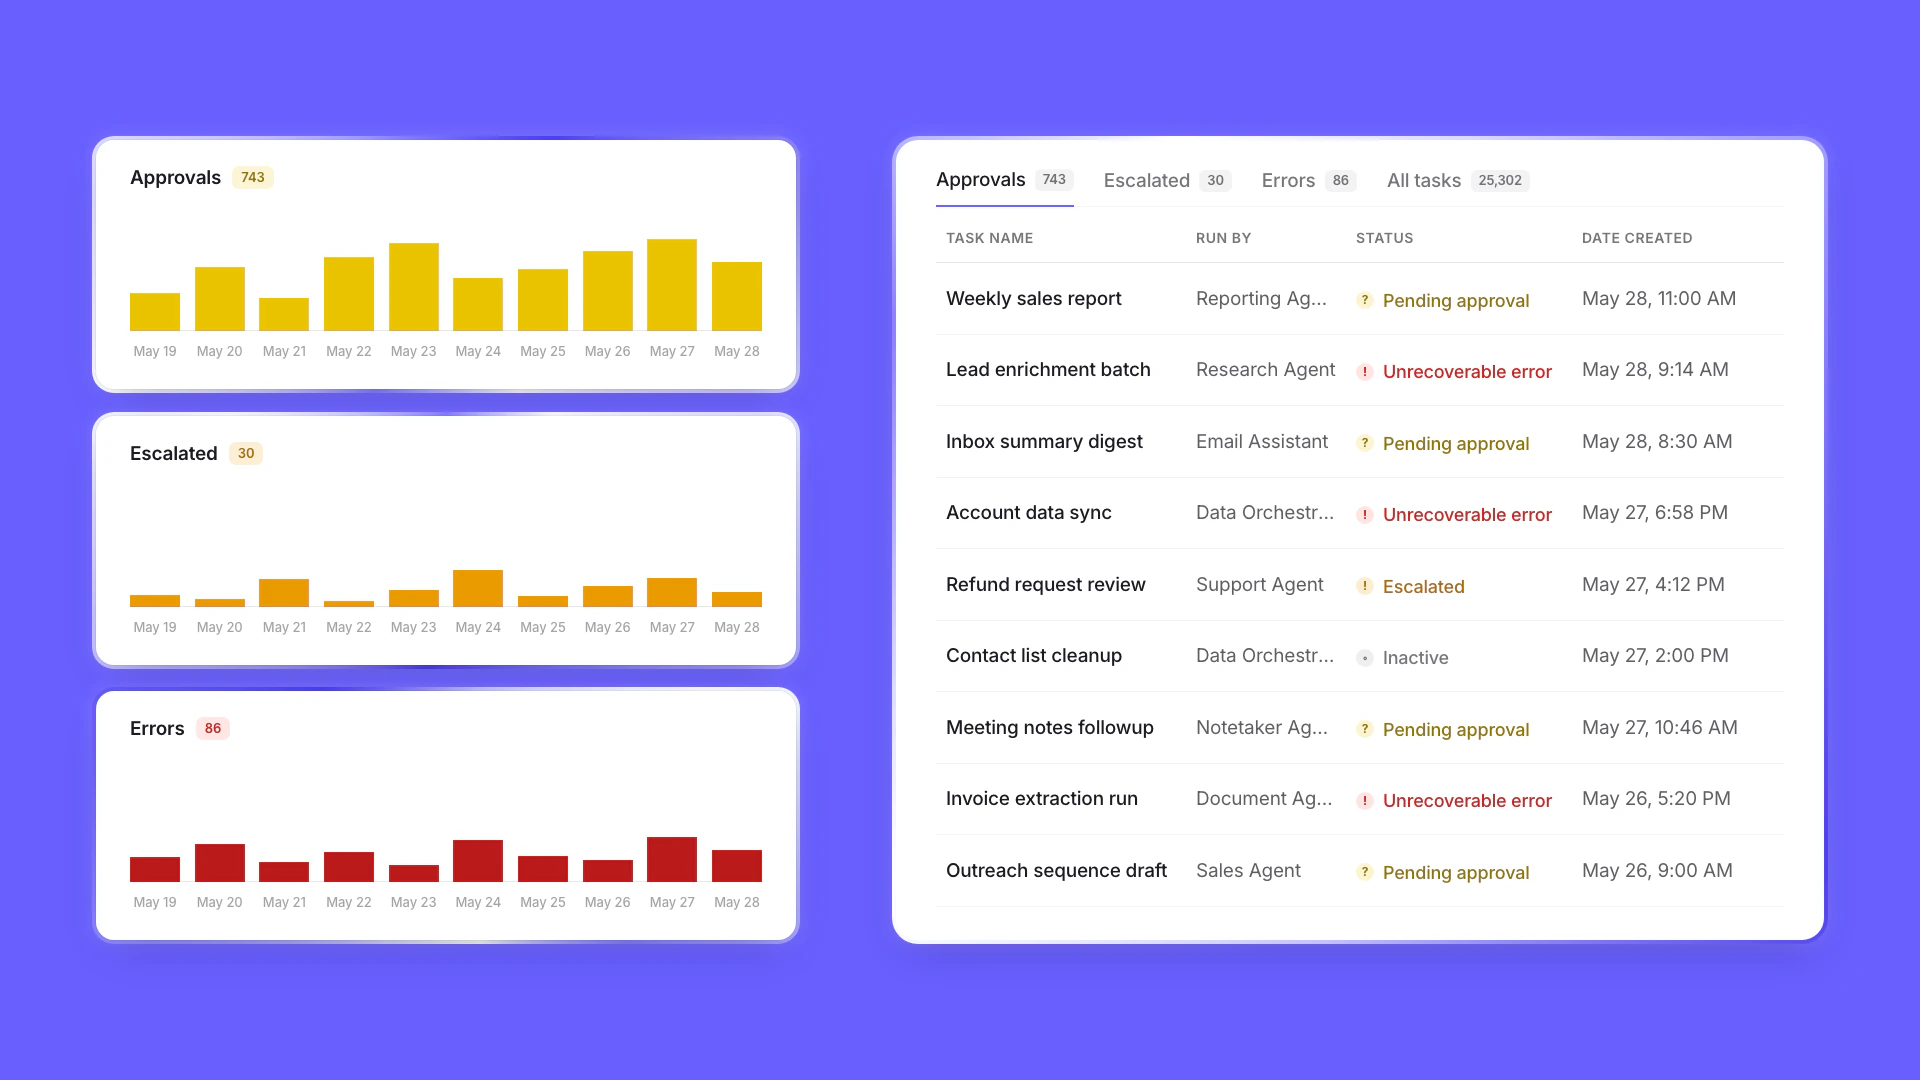
Timeline view added to Tasks page
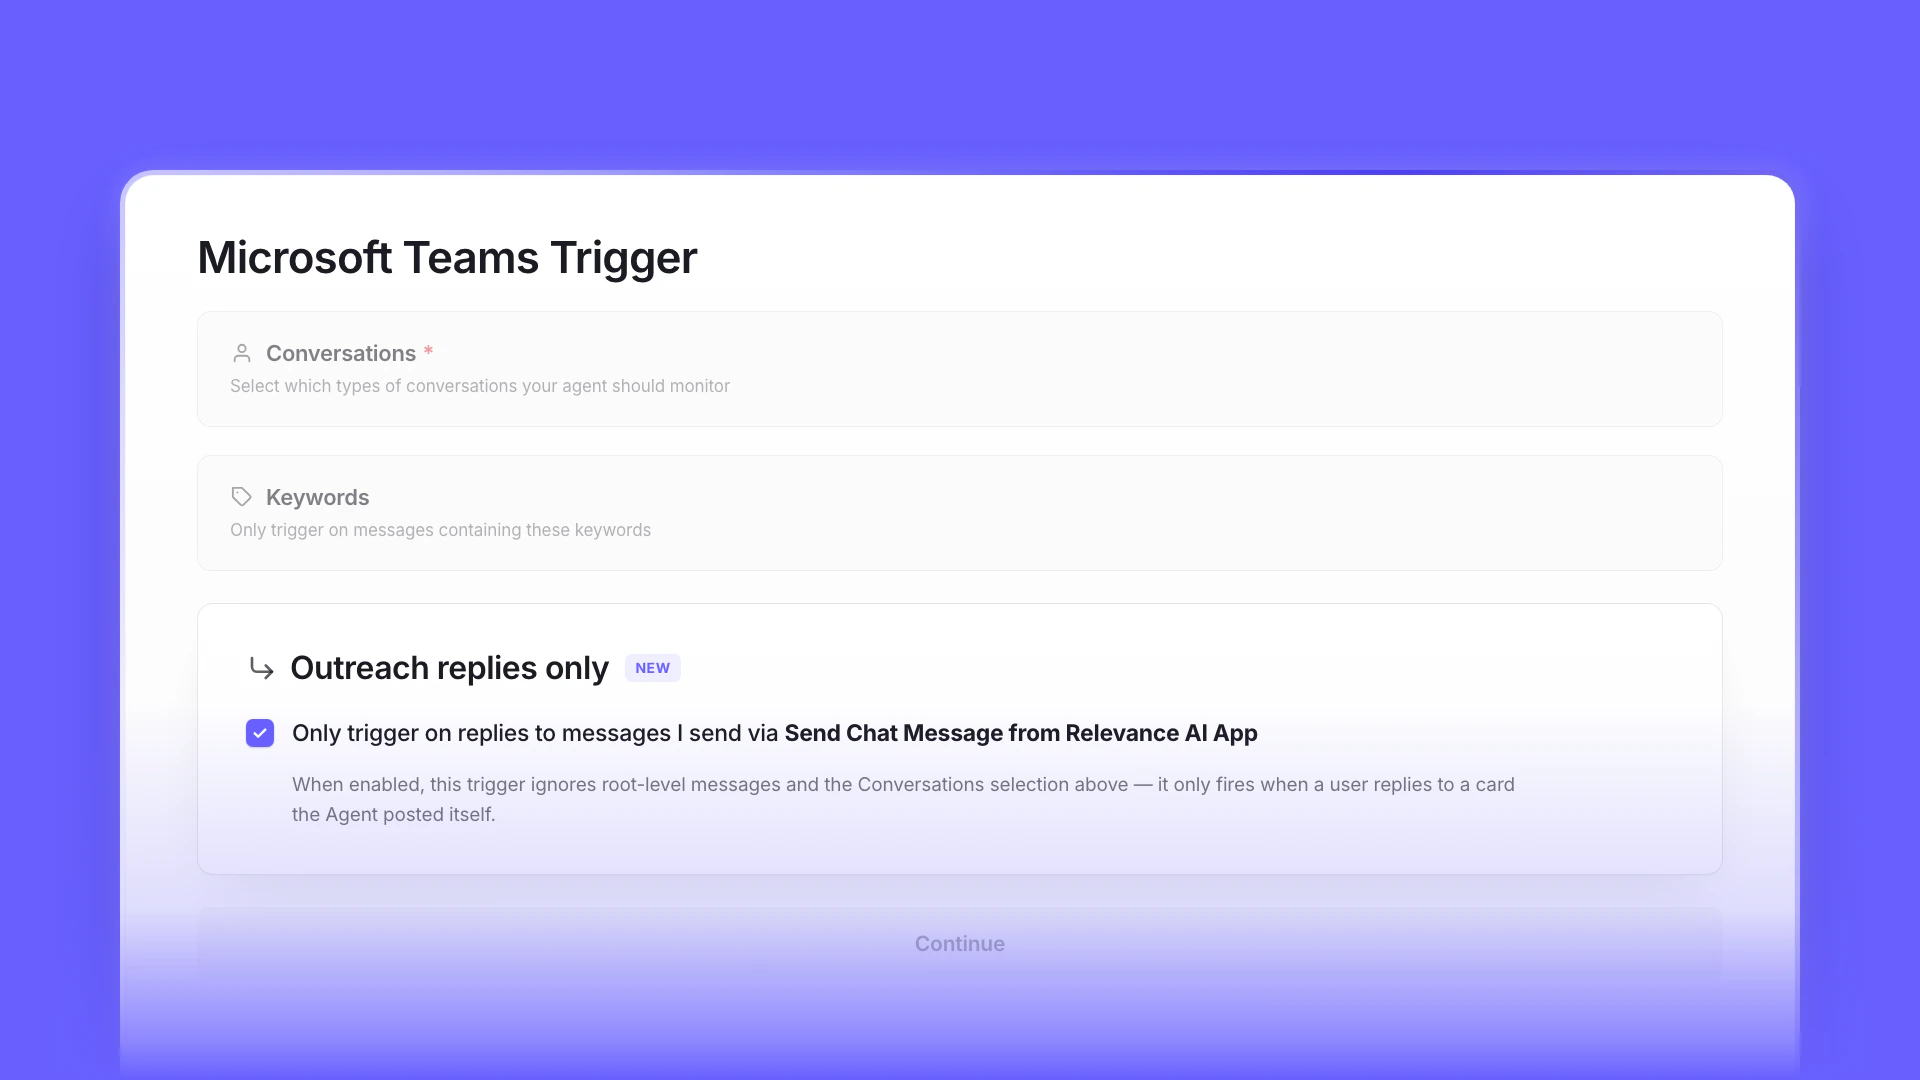
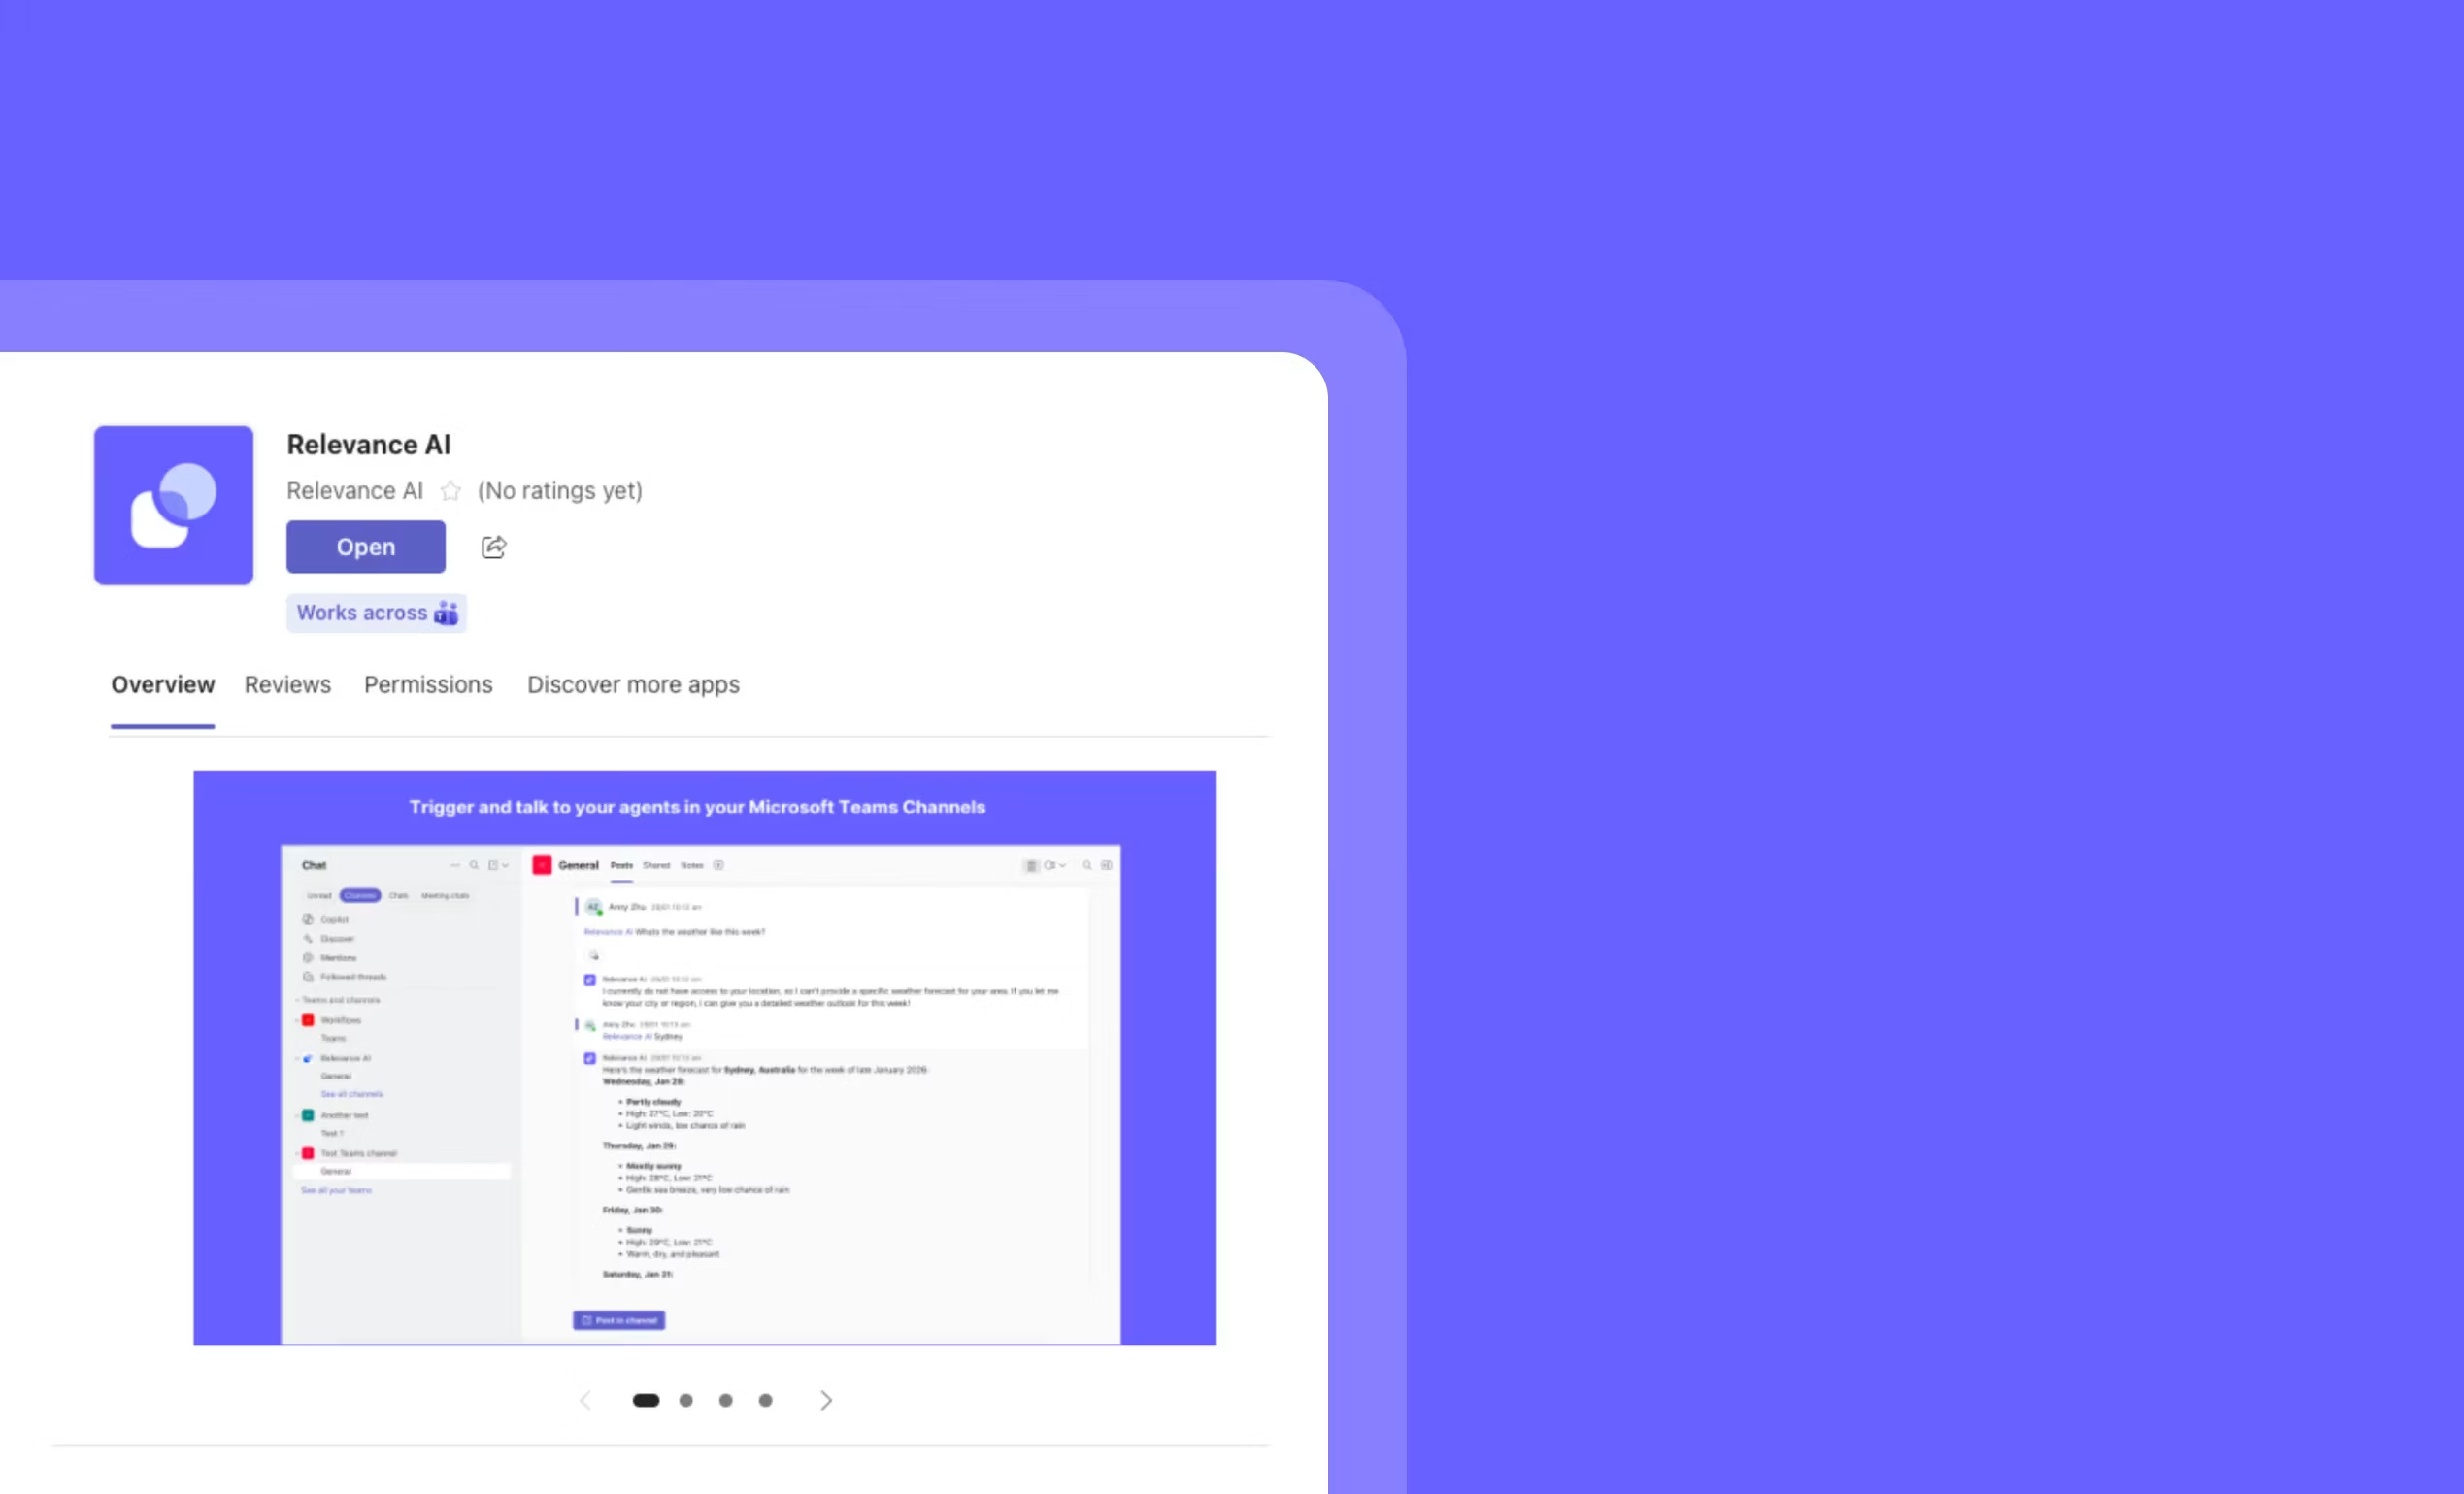
Outreach-only reply mode for Microsoft Teams agents
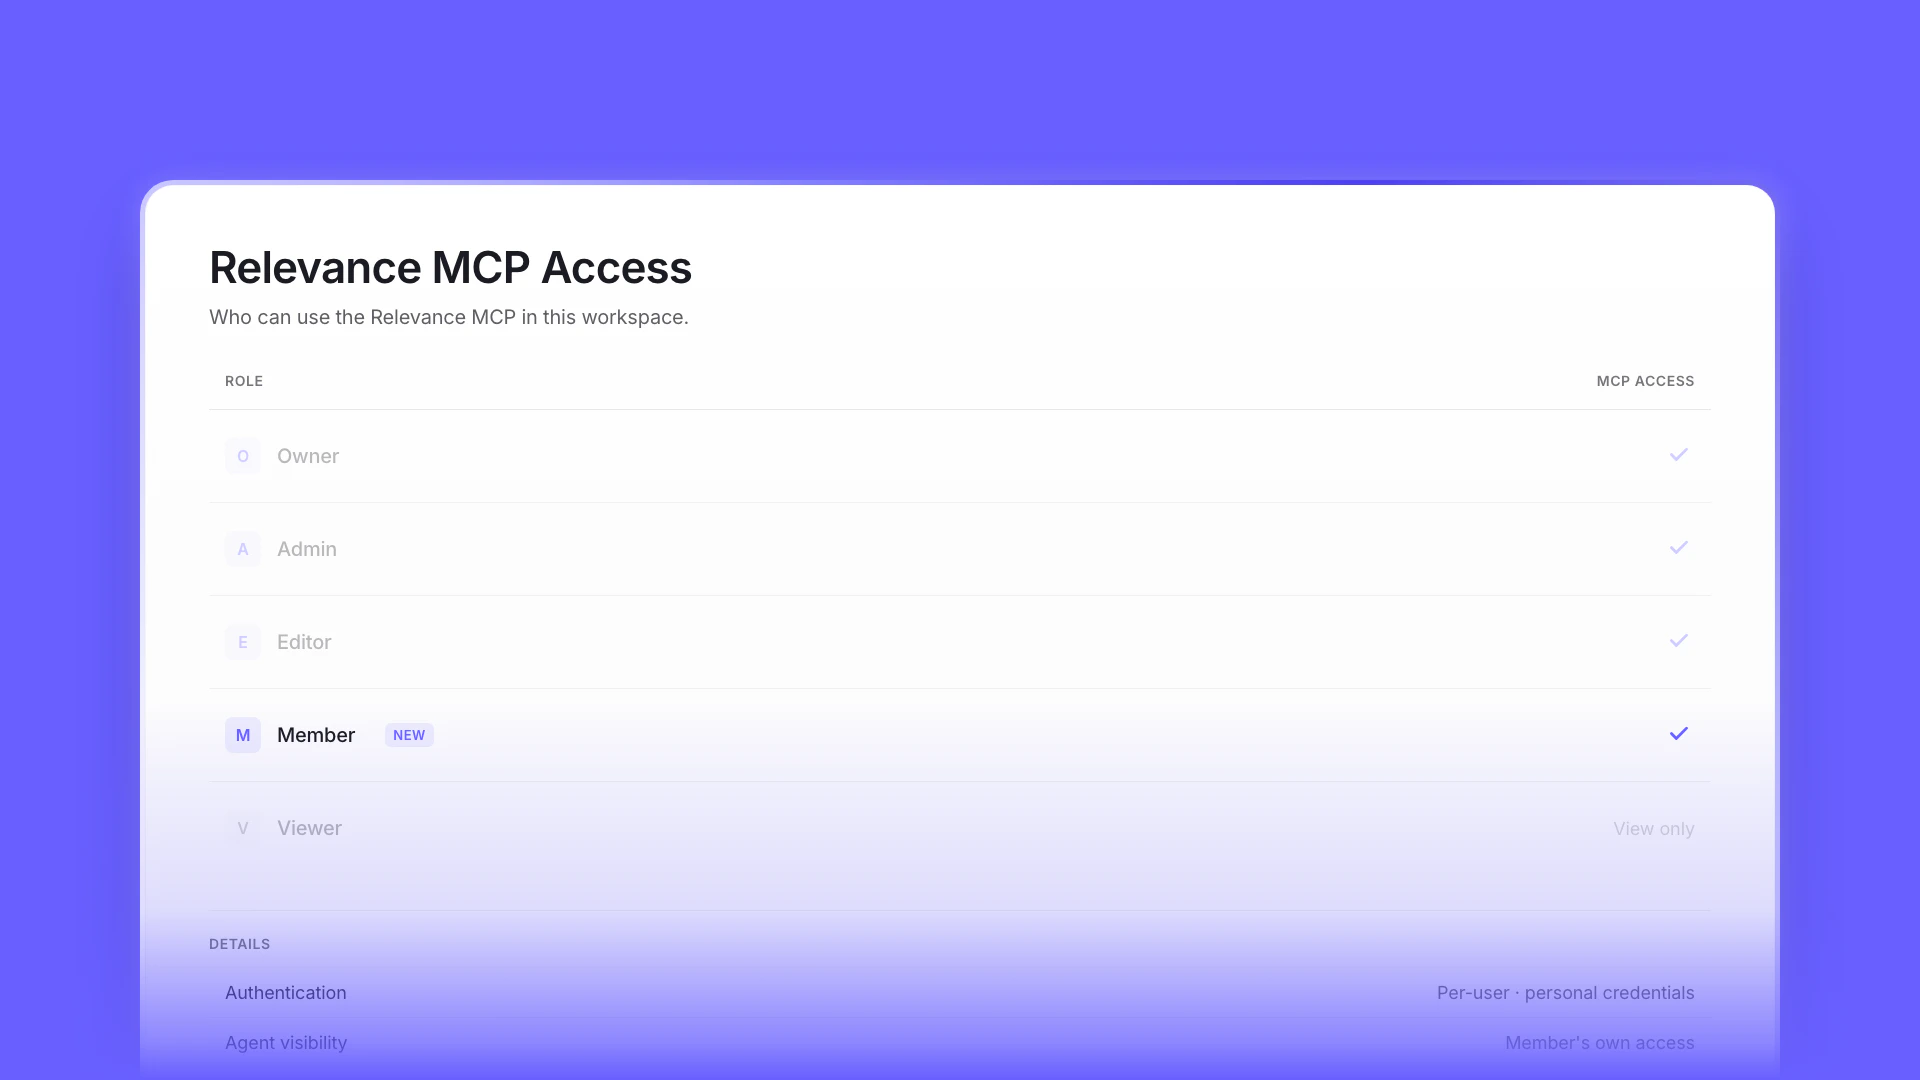
MCP access for the Member role

Other improvements
General fixes and UI improvements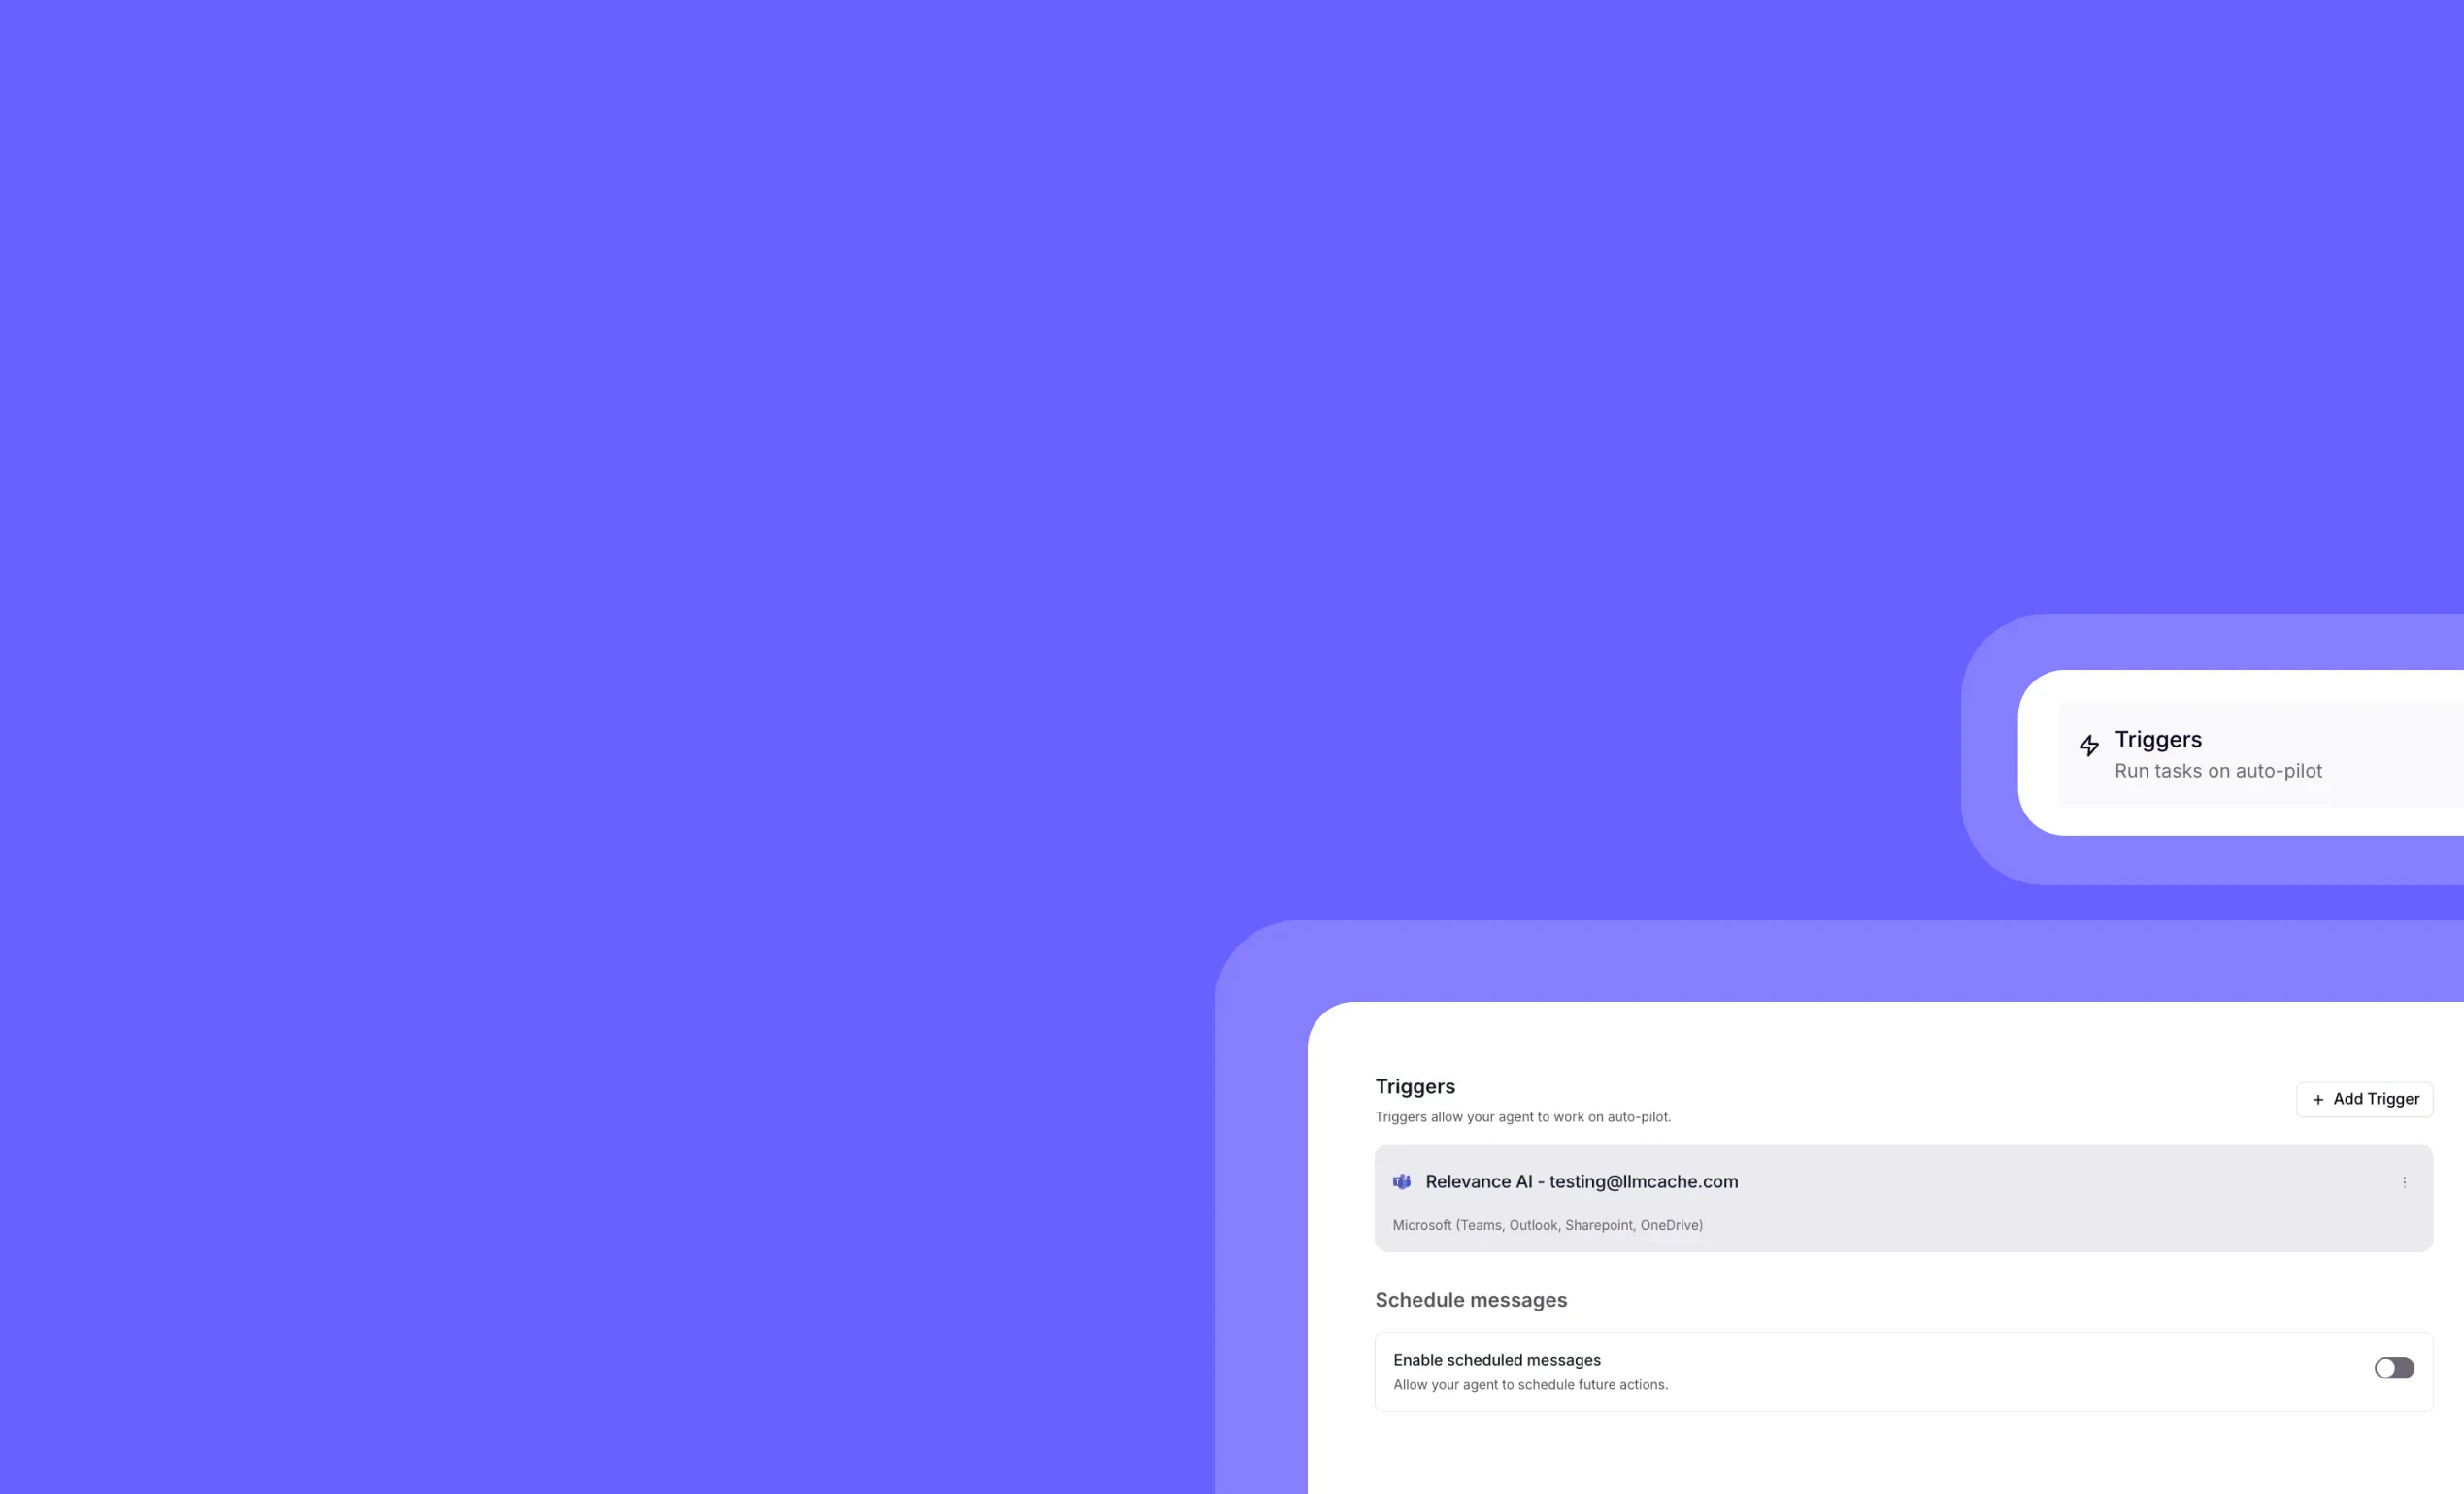

Other improvements
Clean up your workspace in seconds with our new bulk chat deletion feature – perfect for removing those numerous “Hi” test conversations and keeping your environment organized.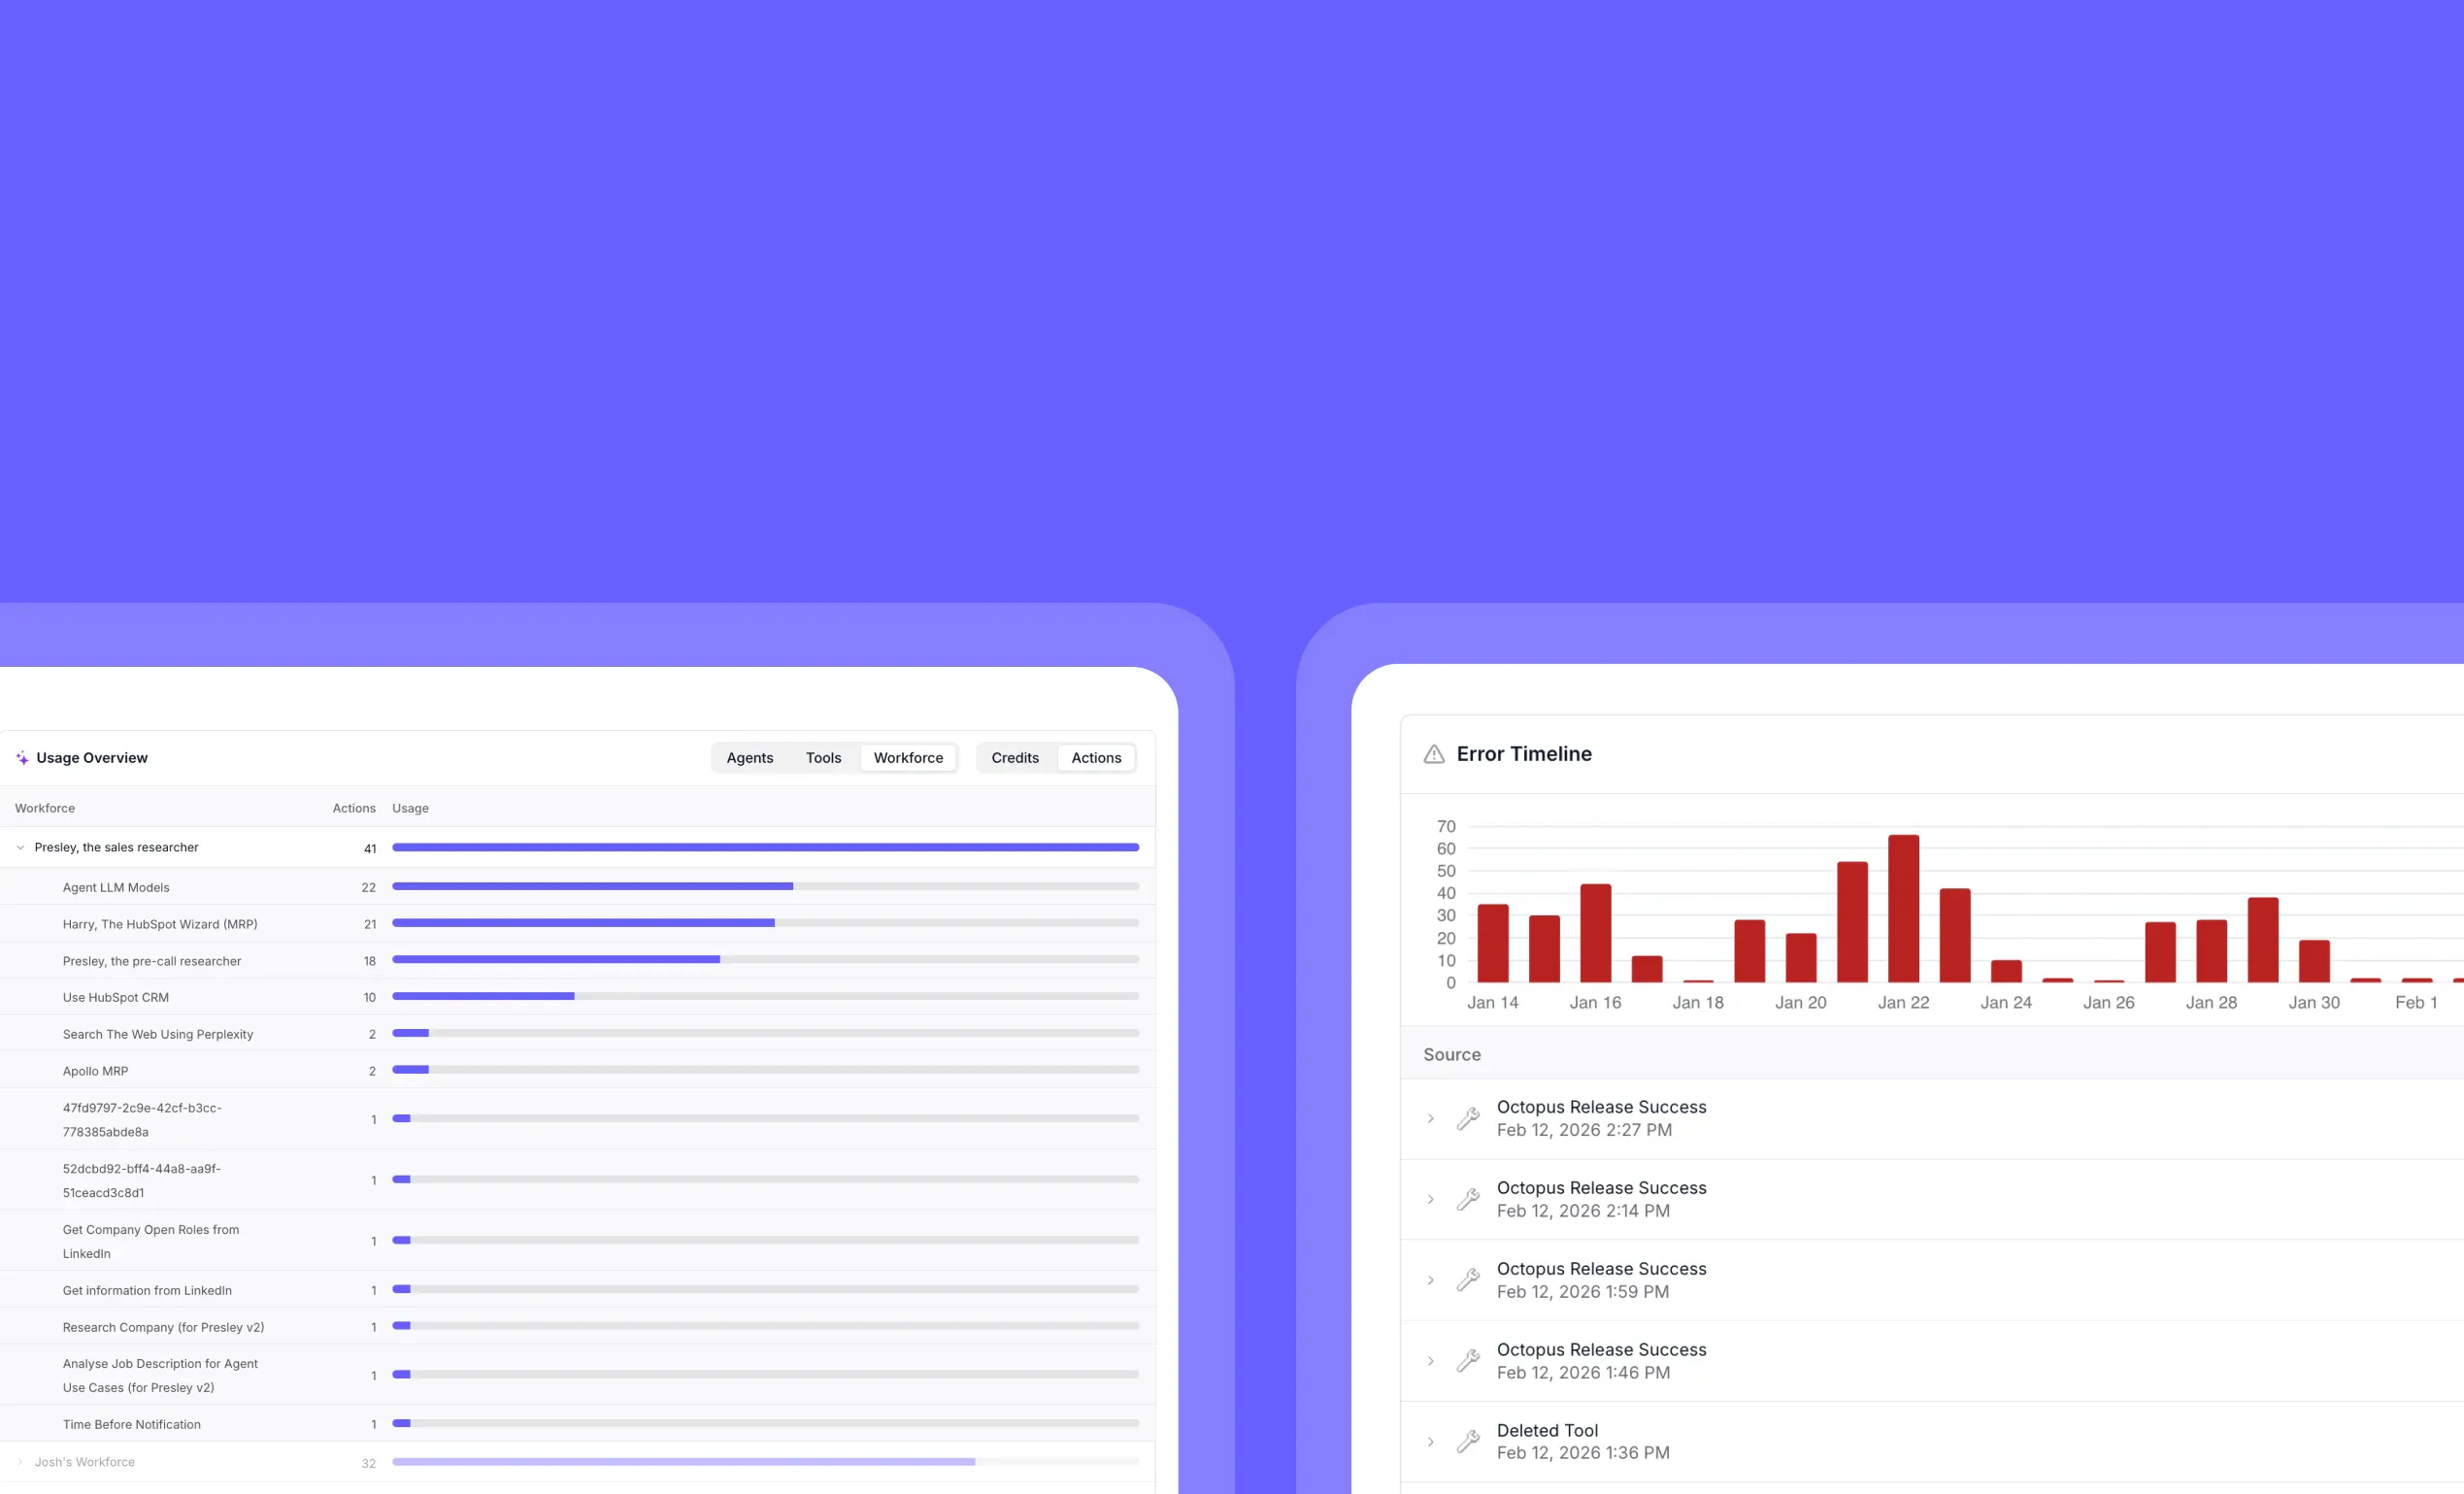
Other improvements
General fixes and UI improvements
Other improvements
General fixes and UI improvements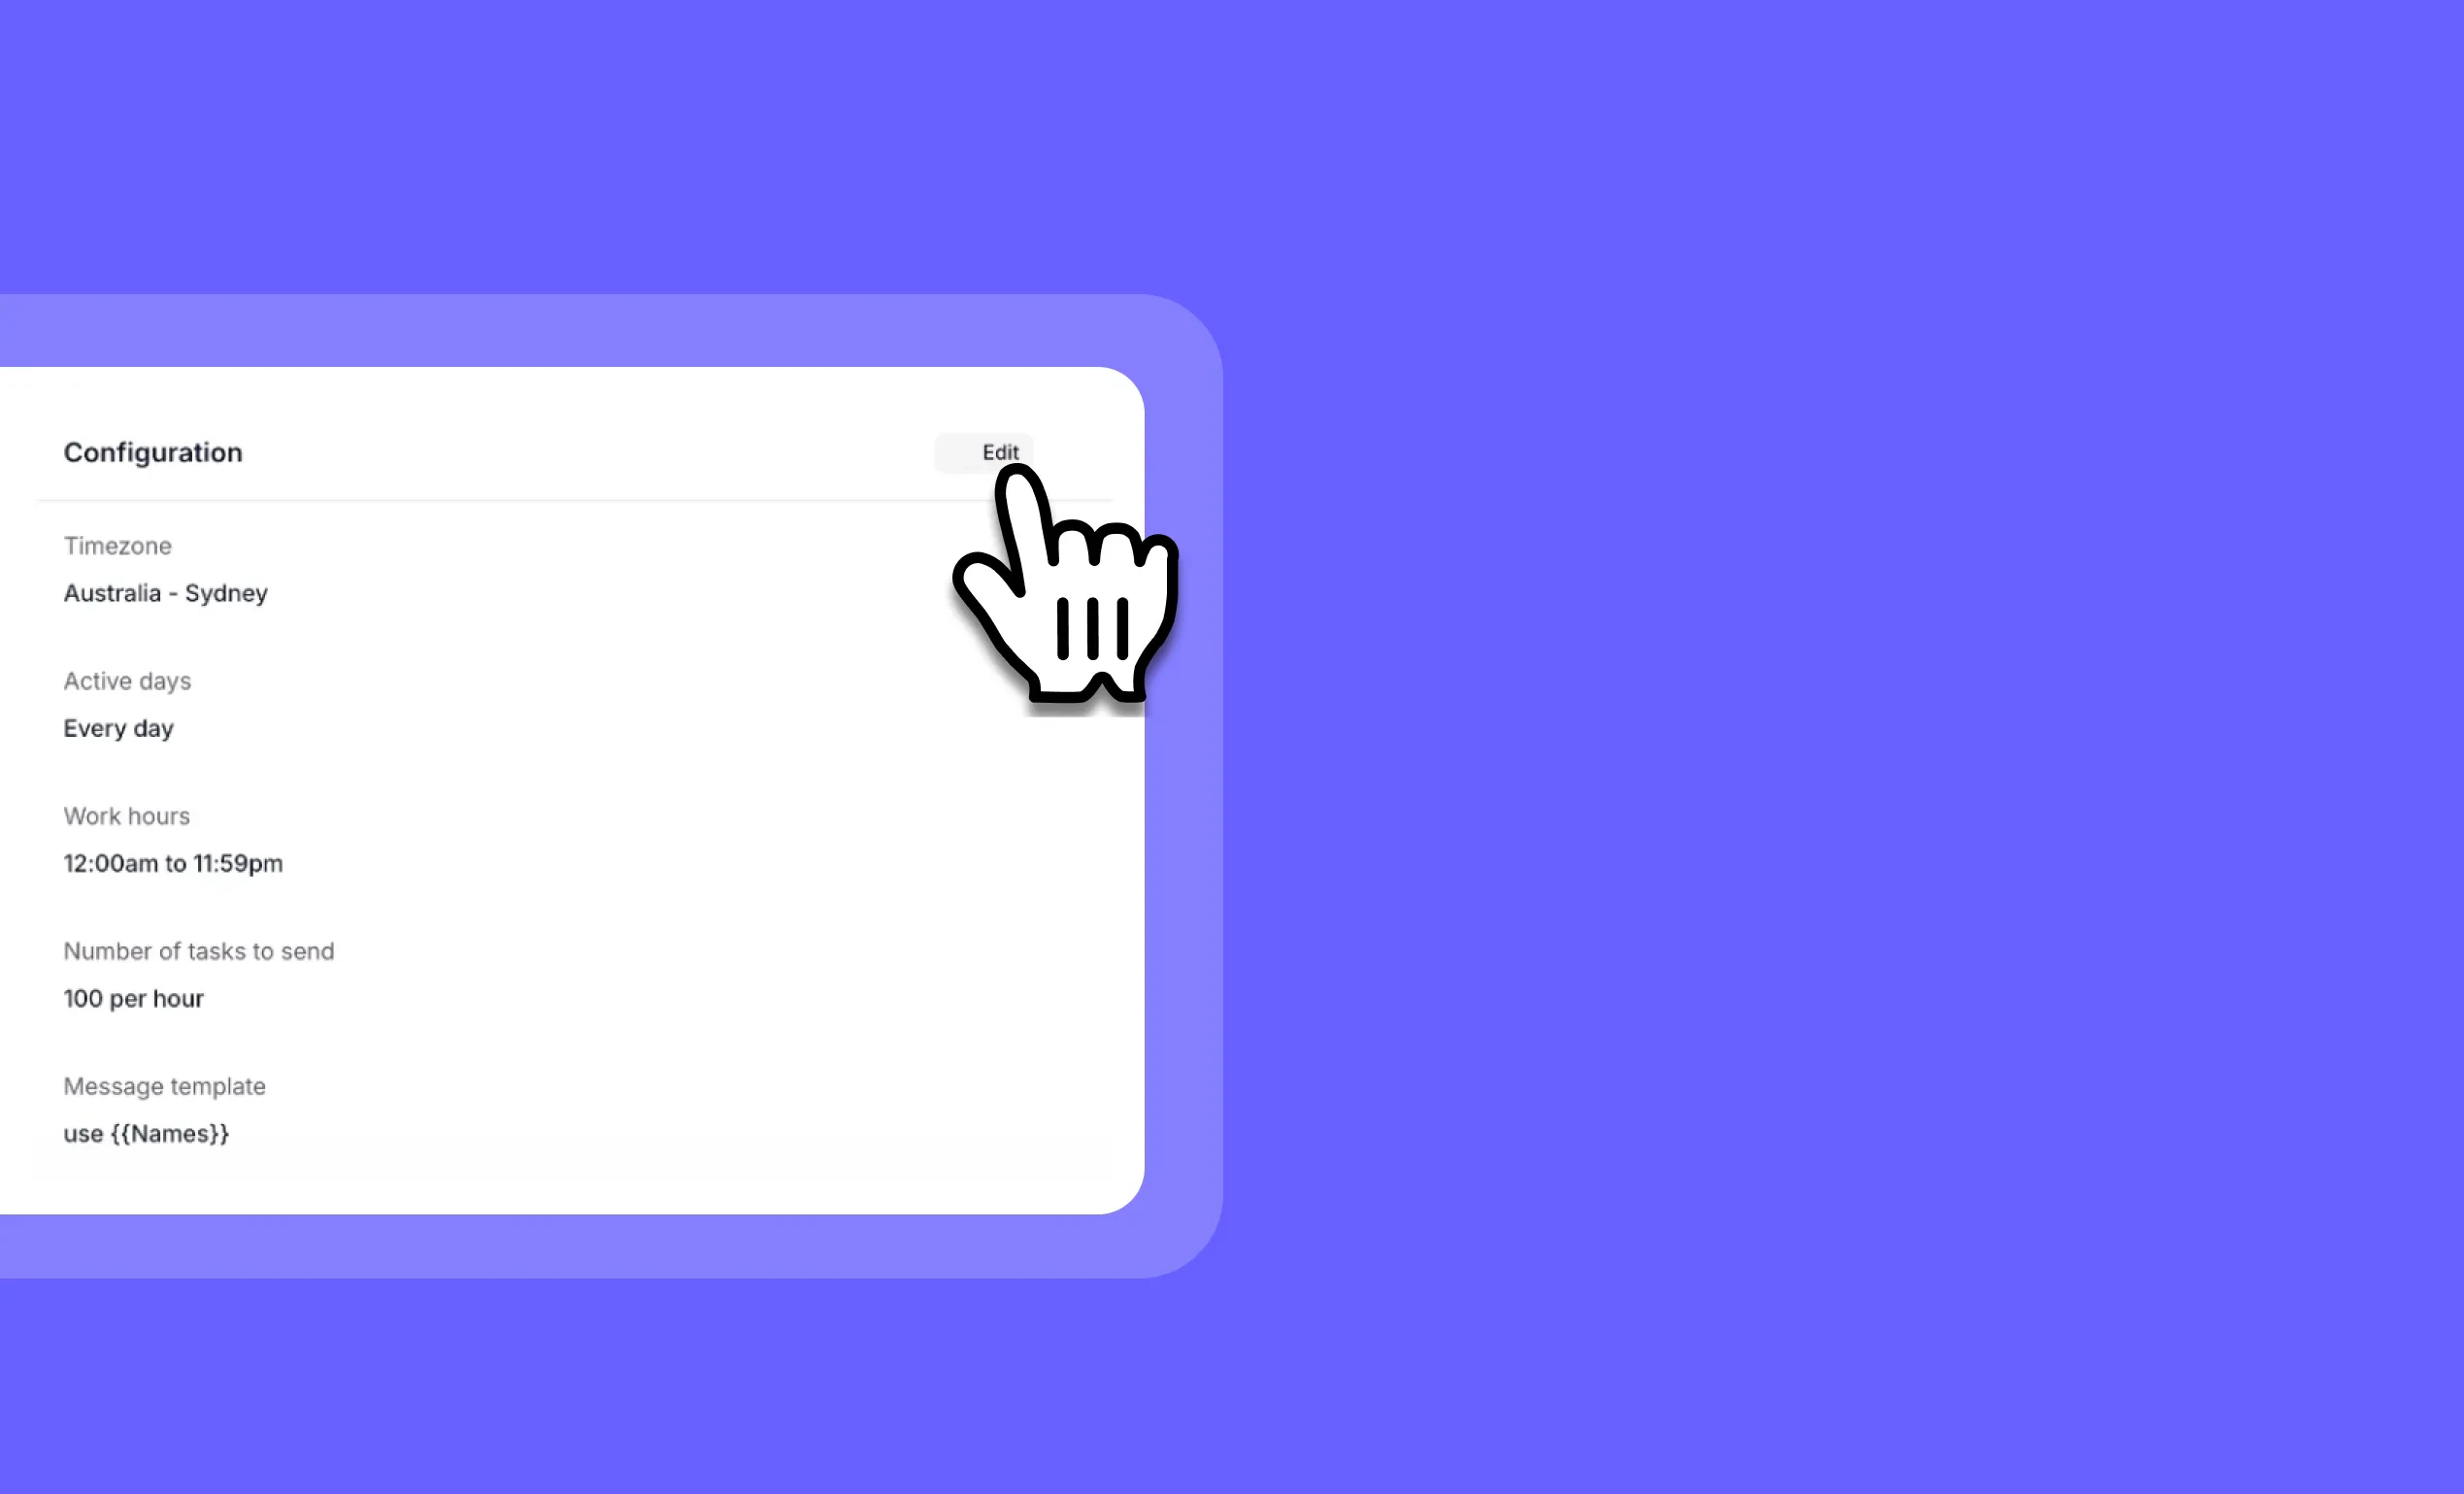
Other improvements
General fixes and UI improvements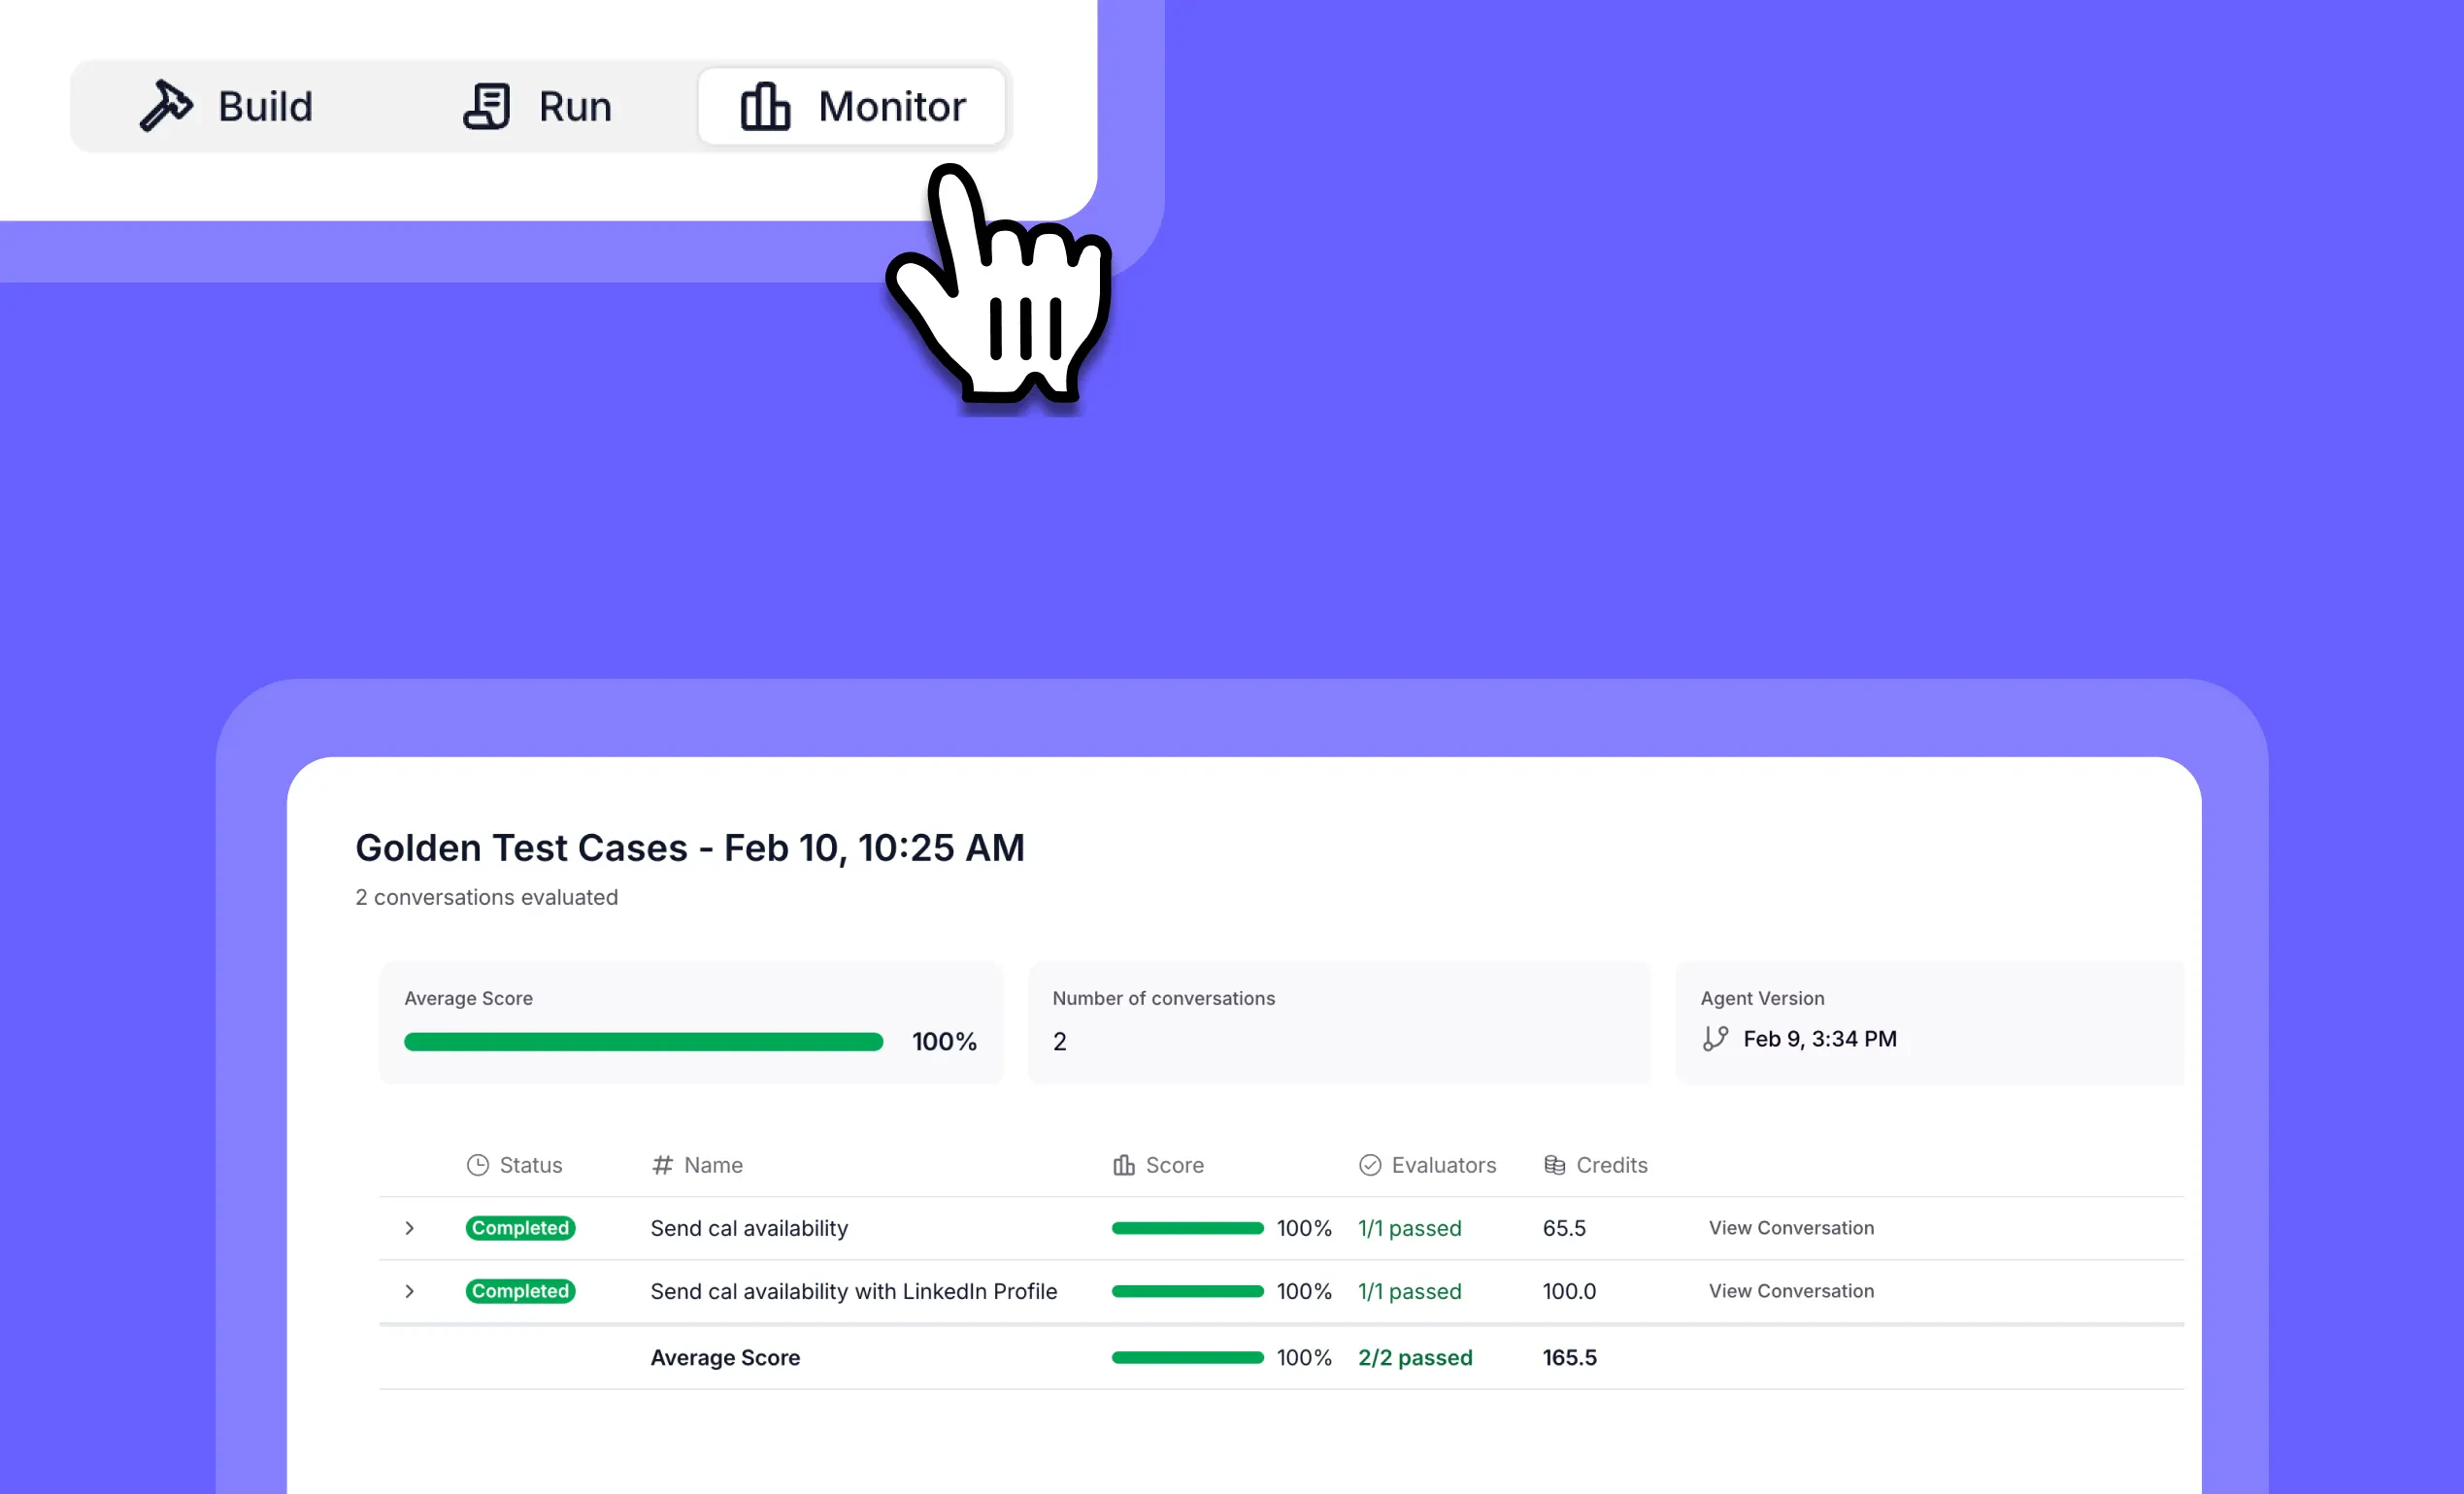
Other improvements
General fixes and UI improvements
Other improvements
General fixes and UI improvements
Other improvements
General fixes and UI improvements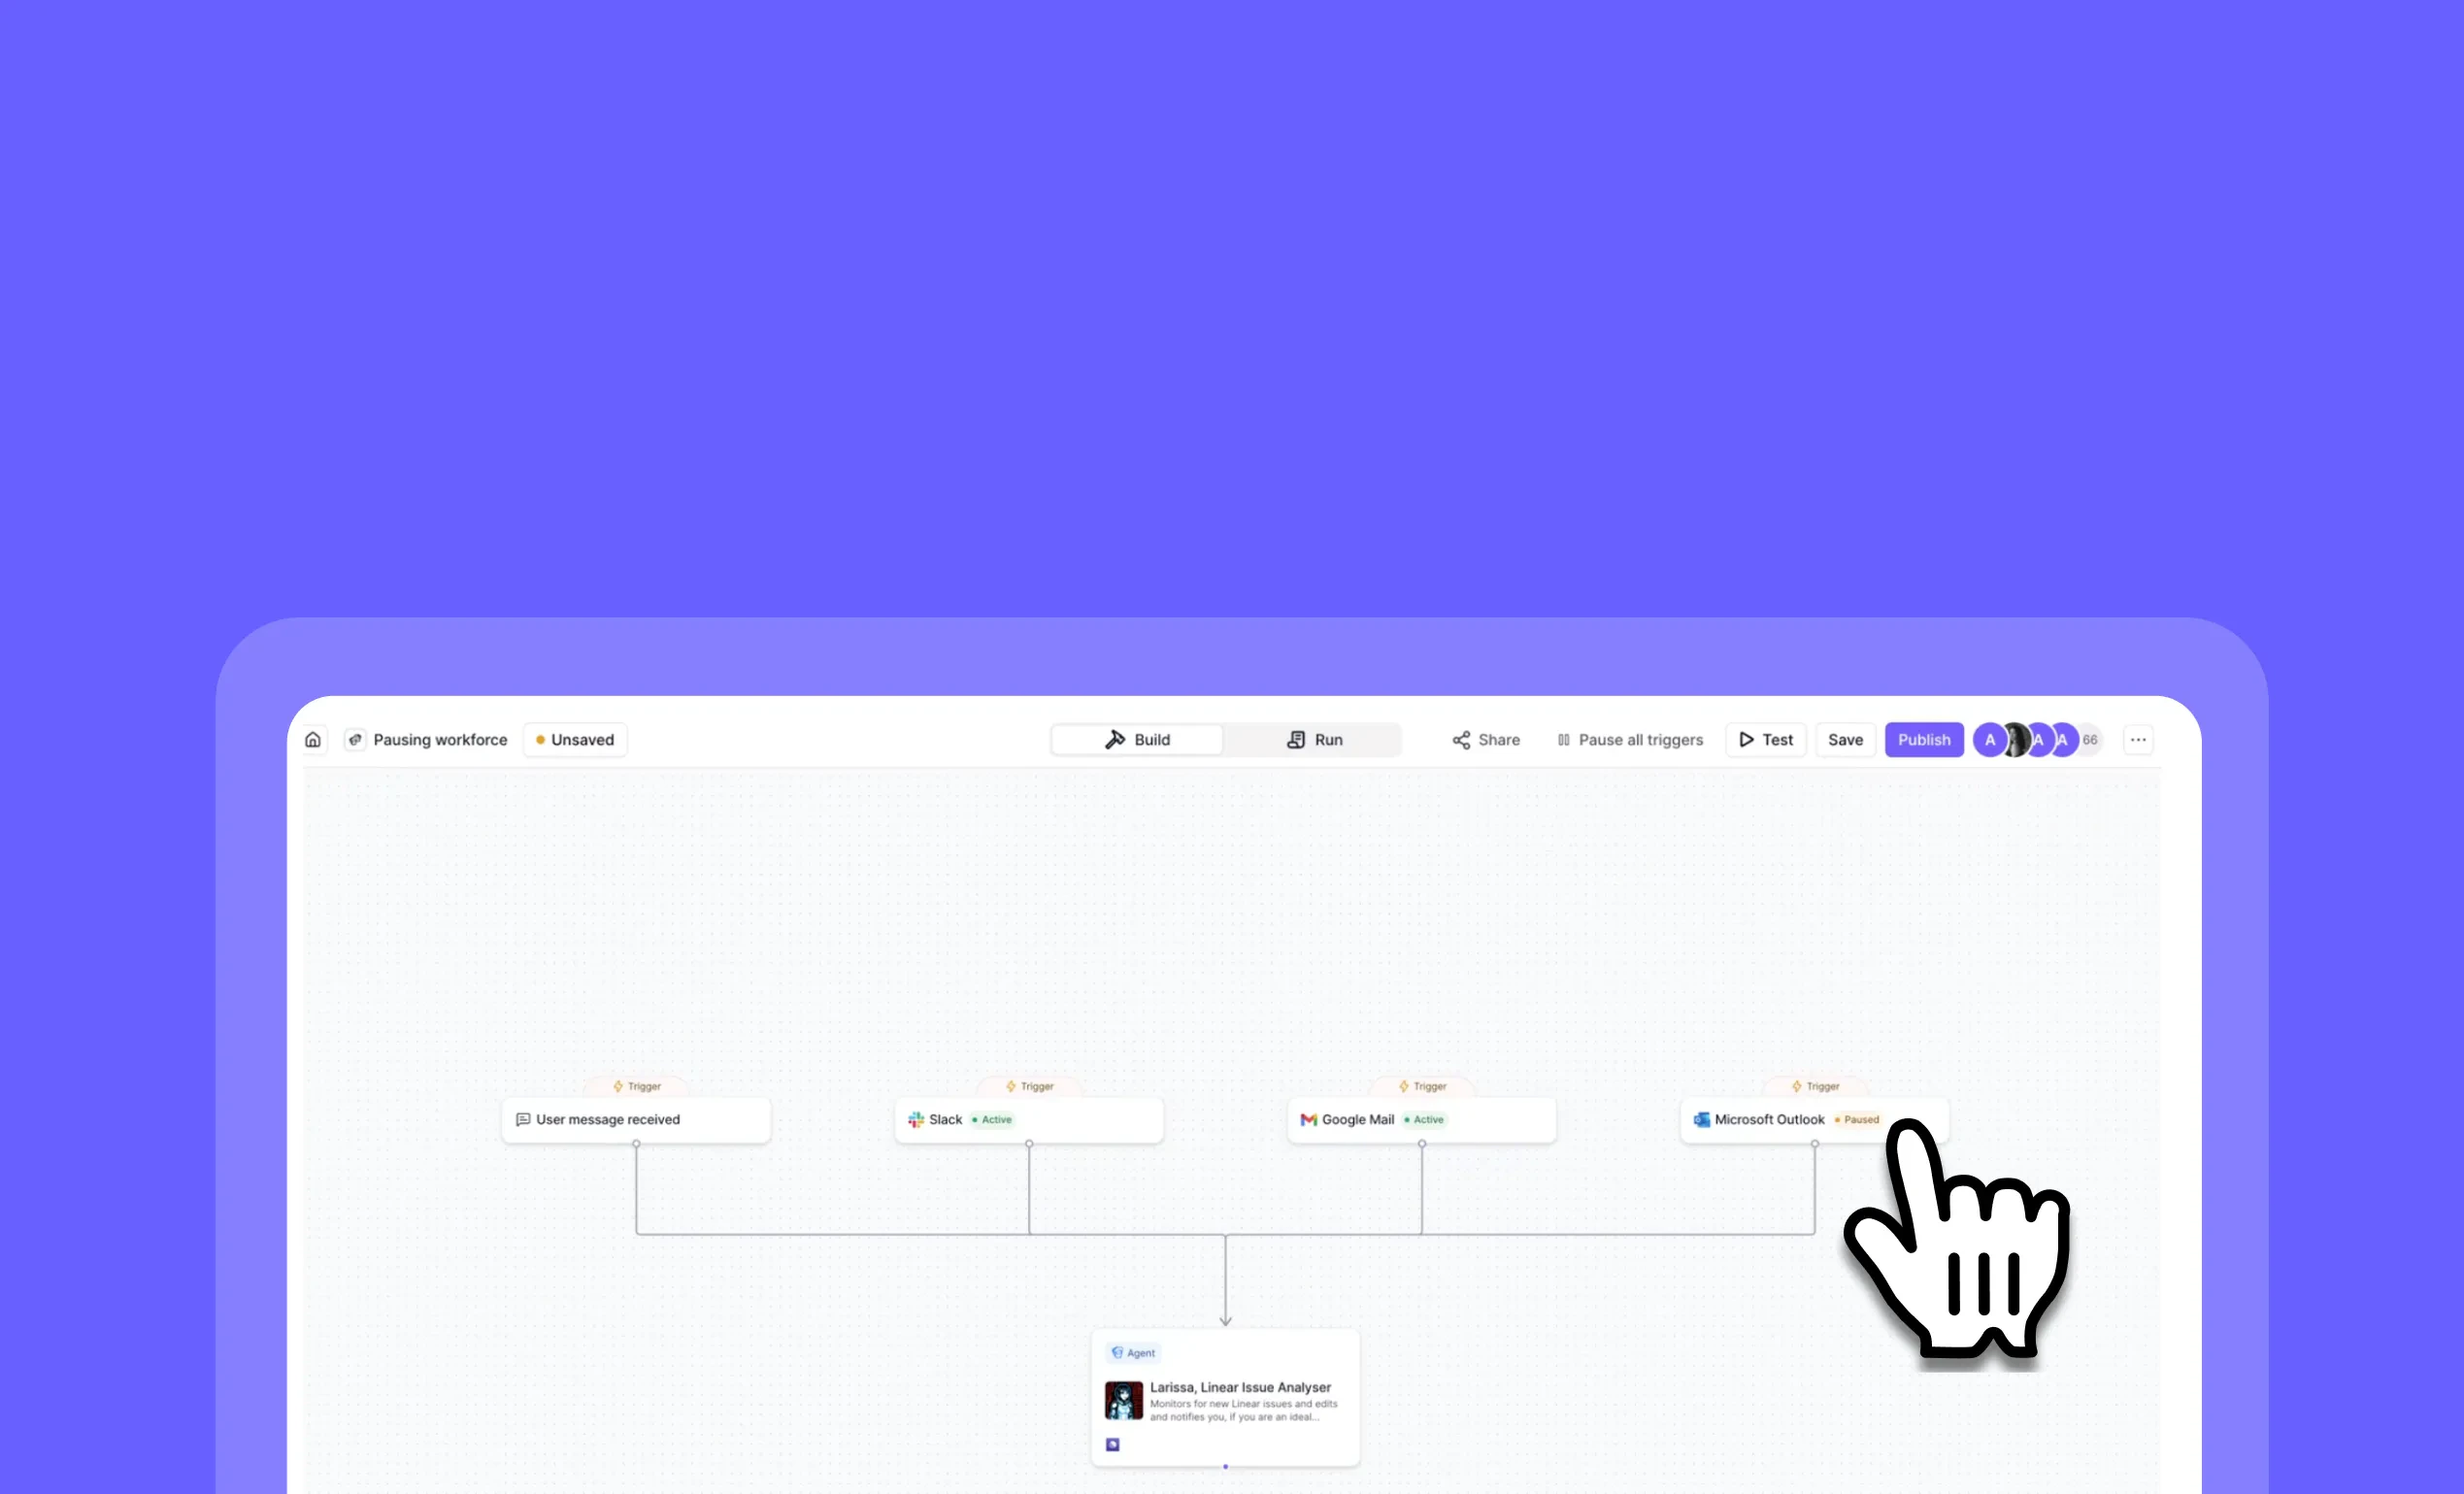
Other improvements
General fixes and UI improvements
Other improvements
General fixes and UI improvements
Other improvements
General fixes and UI improvements
Other improvements
General fixes and UI improvements
Other improvements
General fixes and UI improvements
Other improvements
General fixes and UI improvementsEarlier changes
2025
107 updates
2024
17 updates
2023
8 updates