

Monitoring
Analytics
Monitor your AI workforce performance, costs, and usage in real-time
Analytics gives you complete visibility into how your AI workforce is performing. Track tasks, monitor costs, spot performance issues, and optimize your agents—all from a single dashboard.
Getting Started
Open Analytics
Navigate to Account in your Relevance AI dashboard and click on Analytics
Set Your Filters
Select your date range and choose which agents to analyze
Explore Your Data
Scroll through the dashboard to explore workforce, agent, and action breakdowns
Key Metrics at a Glance
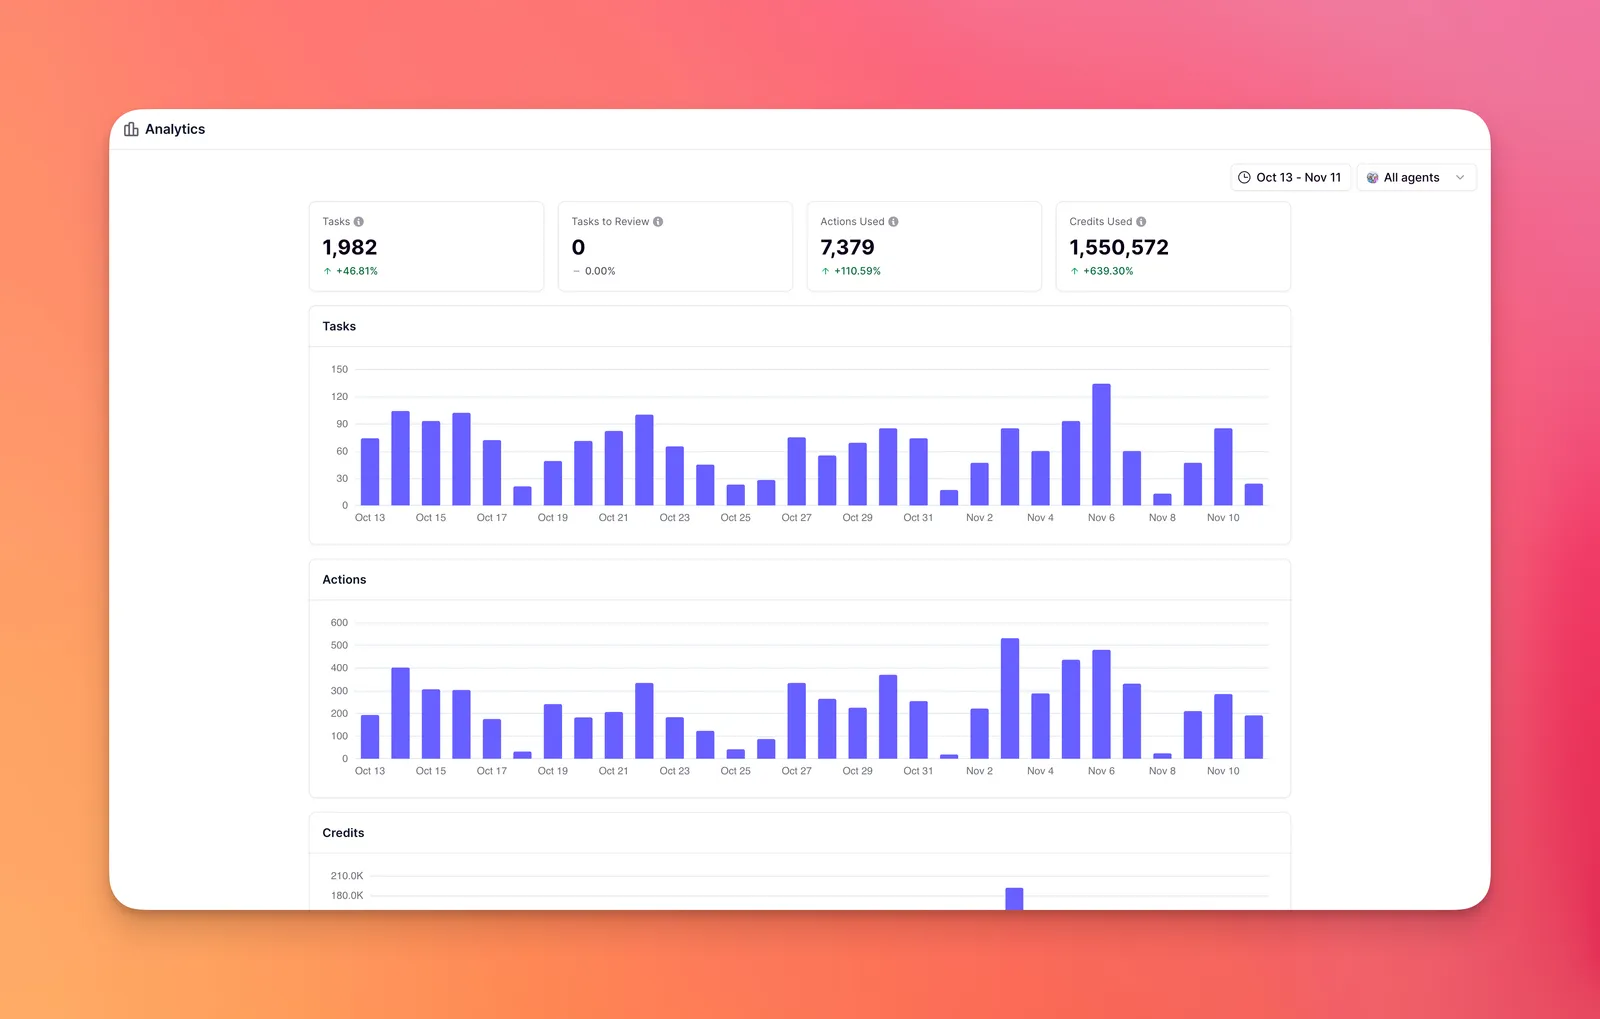
Your Analytics dashboard displays four critical metrics with trend comparisons:
Tasks
Total tasks completed by your agents with percentage change trends
Tasks to Review
Tasks awaiting human approval or review
Actions Used
Number of tool executions and API calls made by your agents
Credits Used
Total Relevance AI credits consumed across all activities
Each metric shows percentage change from the previous period. For example, “+45.78%” on Tasks means you completed 45% more tasks than the previous period—use this to track growth or identify sudden increases in workload.
Dashboard Sections
Task and Action Trends
Interactive charts show your daily task volume and action usage over time.
Quickly identify:
- Peak usage days - Spot which days have the highest bars to understand demand patterns
- Unusual activity patterns - Look for unexpected spikes or drops that might indicate issues
- Growth trends - See if bars are generally increasing (growth) or decreasing (reduced usage)
How to use it: Hover over any bar to see exact numbers for that day. Use the date range picker to zoom into specific weeks or months. Compare task volume with credit usage charts to understand cost patterns.
Credits
A dedicated chart showing your daily credit consumption over time.
Quickly identify:
- Expensive days - See which days consumed the most credits (highest bars)
- Cost anomalies - Spot unexpected credit spikes that might indicate workflows using excessive credits
- Spending patterns - Understand if your credit usage is steady, growing, or fluctuating
How to use it: Hover over bars to see exact credit amounts for each day. Compare the Credits chart with the Tasks chart above it—if tasks are flat but credits spike, you have workflows becoming more expensive. Use this to budget and forecast monthly credit needs based on historical patterns.
Workforce Breakdown
See performance metrics for each of your AI workforces:
| Metric | What It Shows |
|---|---|
| Workforce Tasks | Tasks handled by the workforce |
| Agent Tasks | Individual agent activities within the workforce |
| Error Rate | Percentage of failed tasks |
| Actions & Credits | Resource consumption per workforce |
| Credits/Task | Cost efficiency metric |
How to use it: Compare Credits/Task across workforces to find your most cost-effective teams. Click into any workforce row to see more details. Check the summary stats at the bottom (e.g., “Avg: 95 credits/task”) to gauge overall performance.
Agent Breakdown
Drill down to individual agent performance:
| Metric | What It Tells You |
|---|---|
| Tasks | Volume of work handled |
| Error Rate | Reliability and success rate |
| Actions/Task | Complexity indicator (more actions = more complex workflows) |
| Credits/Task | Cost per task for efficiency comparison |
How to use it: Sort by Credits/Task to find your most efficient agents (e.g., agent with 5 credits/task vs 3,500 credits/task). Use “Show 35 more agents” to view your full agent list. Investigate agents with high error rates or unusually high Actions/Task ratios.
Action Breakdown
See which specific tools and integrations are being used:
| Metric | Purpose |
|---|---|
| Executions | How often each action is called |
| Error Rate | Action reliability and integration health |
| Tasks | Number of tasks using this action |
| Credits/Exec | Cost per execution |
How to use it: Check which actions have high execution counts to see your most-used tools. Actions with 0.00% error rates are working reliably. If an action shows error rates above 0%, investigate that integration. Sort by Credits/Exec to find expensive API calls or tool executions.
Concurrency usage
The Analytics page includes a concurrency usage chart. The chart shows organization-wide concurrency data — not data specific to a single agent — so you can correlate agent activity with overall concurrency patterns and see which agents are most active during peak periods.
For information about concurrency limits by subscription tier and how to monitor usage from the Plan & Billing page, see Plans and credits.
Why Use Analytics?
Cost Control
Monitor the Credits Used metric and watch for percentage spikes. Compare Credits/Task across agents to find expensive workflows and optimize them
Performance Optimization
Sort agents by Credits/Task in the Agent Breakdown table. Agents with lower credits per task are more efficient—study their setup to replicate success
Error Monitoring
Check the Error % column in each breakdown table. Sort by error rate to quickly identify which agents or actions are failing and need attention
Capacity Planning
Use the date range filter to compare different periods. Watch for consistent upward trends in the task chart and high percentage changes to identify when you need more agents
ROI Visibility
Point stakeholders to the Tasks metric showing volume completed and Credits/Task showing cost efficiency. The summary stats at table bottoms provide quick proof of value
Troubleshooting
Look for unusual spikes in the charts, high error rates in tables, or agents with abnormally high Credits/Task ratios to catch issues early