
You interact with data whether or not you realize it; here’s the difference between quantitative data vs qualitative data and how to leverage them to gain valuable data insights and expand your use cases.
Picture This
You’re a freshman stepping onto the grounds of the university you will call home for the next four years. You like to study and slave away at the mundane busy work some professors assign.
The one problem you face is that all of the study areas, such as the library and cafe nooks on campus, seem to be occupied with, surprisingly, other students studying away.
A thought pops into your head to solve this problem. You decide to count the number of students in each study area to determine which are the least occupied.
Understanding your data
This type of data gathered is called quantitative – it’s able to be put into a number format.
Once you’ve assembled the list of busiest to least busy study areas, you then proceed with the next step, to ask the students why they like these locations so you can perhaps find a place people are not likely to go to study.
This type of data is called qualitative because it can’t be measured and describes characteristics in a narrative form.
This whole research process has led you to a conclusion or given you, at the very least, the data to make a sound and logical conclusion.
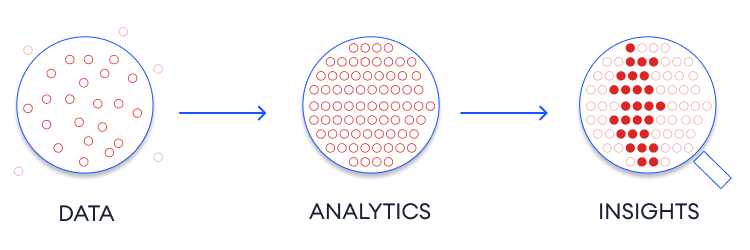
The ability to do this is because of data insights which are the patterns, occurrences, and commonalities that help you determine the best conclusion for your decision.
You realize there is no place to study. And thus the best option is to not study and hope the tests aren’t too hard. Good for you.
A Breakdown Of Data Insights
There’s a lot of talk about data insights, but what does it actually mean?
From one perspective, data insights are the understanding and exploitation of patterns in data.
This might include recognizing trends or correlations, discovering new relationships among variables, or predicting future events.
But that’s not all there is to it. Data insights can also refer to the ability to take complex data and turn it into something meaningful and actionable for business users or other stakeholders. (curious how this works? Try our platform – here)
In this sense, ‘data insight‘ means taking raw numbers and turning them into information that people can use to make better decisions – whether they’re managers trying to optimize their operations or consumers looking for products that meet their needs.
In either case, though, gaining insights from data is all about seeing beyond the surface level and uncovering hidden meaning in the numbers.
It’s not always easy – in fact, sometimes it can be downright challenging – but with patience and perseverance (and maybe a little bit of luck), anyone can learn how to do it.”
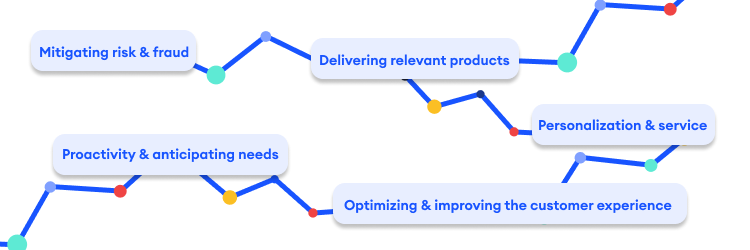
Benefits of Data Insights
They can provide valuable information about how your business is performing, who your customers are, and what strategies you should pursue in order to improve your bottom line.
But the benefits of data insights don’t stop there. Data-driven decision-making has been shown to improve organizational performance across a variety of industries.
In fact, a recent study by MIT found that companies that make decisions based on analytics perform up to 25% better than their competitors!
So if you’re looking for a way to give your business an edge over the competition, investing in data analytics is definitely the way to go.
And luckily for you, there’s no shortage of resources available online to help you get started. (Here’s one to get started on your journey – Relevance AI Learning Center)
Quantitative Data
There is usually a bit of confusion around the terms “quantitative” and “qualitative” data. So, what exactly is the difference?
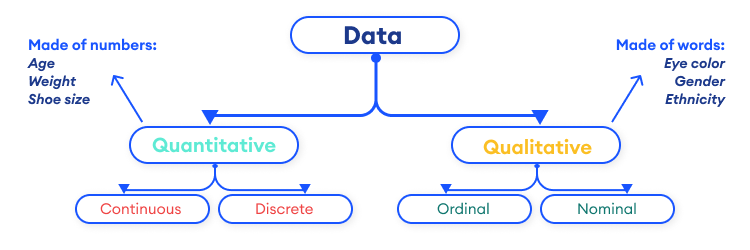
Quantitative data is numerical in nature and can be measured or counted. Qualitative data, on the other hand, cannot be quantified and is instead characterized by its descriptive qualities.
The history of quantitative vs. qualitative data insights goes back to the early days of statistics. In those days, statisticians would use qualitative methods to understand their data – for example, through interviews or focus groups.
However, they would then use quantitative methods to analyze that data (for example, through surveys). This was done in order to measure relationships between different variables and identify patterns in the data.
Some fields where qualitative methods are more commonly used than quantitative ones – for example, sociology and market research.
However, most fields have moved towards using a mix of both qualitative and quantitative techniques in order to get a complete understanding of their data.
Quantitative techniques include things like statistical analysis, while qualitative techniques include things like interviews or focus groups.
By using both types of techniques, researchers can gain a deeper understanding of their data. This approach is often called mixed methods research.
There are many benefits to using mixed methods research: it allows you not only to understand your data better but also helps you build theory, makes your research more credible, and increases its transferability.
Once you’re in the mix of quantitate data there is then segmented types based on what you’re analyzing.
Discrete data is easy to understand. It’s like counting things- 1, 2, 3, 4. There are a finite number of items, and you can count them one at a time.
Continuous data is more difficult to conceptualize. It’s like measuring the temperature or the amount of rainfall over time. The measurements are always changing, and there is no clear dividing line between one value and the next.
In practice, most real-world data is actually a mix of both discrete and continuous values. For example, when you measure someone’s height, you get a discrete value (e.g., 170 cm).
But if you measure their weight over time, you’ll get continuous values (e.g., 67 kg today; 68 kg tomorrow).
So which type of data is better? That depends on what question you’re trying to answer! If the goal is to track changes in someone’s weight over time, then continuous data would be best suited for that task.
However, if your goal were to find out how many people are taller than 170 cm, then discrete data would be more appropriate.
Qualitative Data
Qualitative data is the lifeblood of any data scientist, student, or engineer. It’s what we use to understand our data and make informed decisions. Without qualitative data, our quantitative analysis would be meaningless.
So what is qualitative data? Simply put, it’s any information that can’t be easily quantified. This includes things like text, images, and videos.
Qualitative data is often used to provide context for quantitative results and can help us identify patterns and trends that wouldn’t be obvious from just looking at numbers alone.
Unstructured Data
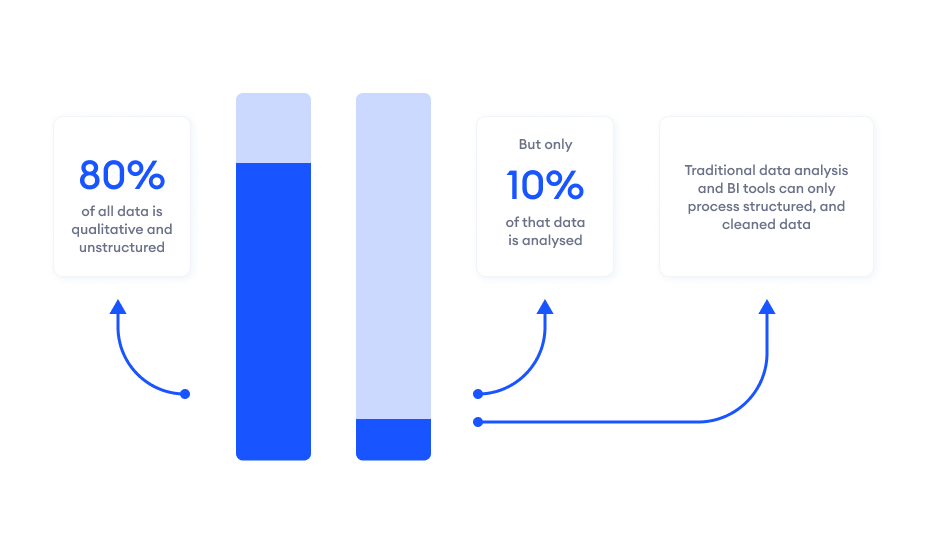
Unstructured data can be a bit of a wild west for data scientists. It can include anything from text and images to feedback and reviews. This kind of data is difficult to work with because it’s not organized in a neat, tidy way like structured data is.
But that doesn’t mean unstructured data isn’t valuable! In fact, it can be extremely useful for businesses and data scientists alike.
Unstructured data is all around us. It’s in the text of our emails, the images we post on social media, and even in the feedback we give to others.
And while it can be a challenge to work with unstructured data, it’s also where some of the most interesting insights can be found.
For example, take a look at this image:
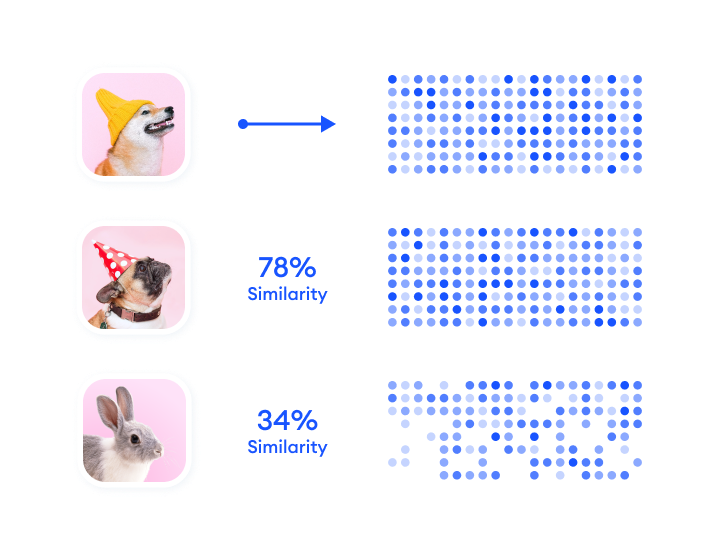
It’s just a simple picture of some animals, but there’s actually a lot of information hidden in there.
By analyzing the colors and shapes in the image, you could learn about things like animal species or type. You might even be able to determine how alike the pets are based on their coloration.
Text is another great source of unstructured data. With natural language processing (NLP), you can analyze large volumes of text to find trends or patterns that wouldn’t be detectable any other way.
NLP
For example, NLP could help you figure out what topics people are talking about on social media or identify customer sentiment from reviews and feedback forms.
The bottom line is that unstructured data should never be underestimated – it can provide valuable insights into your business and customers that would otherwise be inaccessible
One of the best things about qualitative data is that it’s so versatile. It can be used in different applications, from market research to product development to customer service improvement initiatives.
And with the rise of big Data analytics toolsets, extracting value from qualitative sources has never been easier! (Try our platform to dive into your unstructured data ASAP!)
Types of Qualitative Data
Once more, the same segmented types of qualitative data vary based on what is being analyzed.
Nominal and ordinal data are two types of data that are often used in statistics. Nominal data is when the values assigned to each observation are just labels, such as “male” and “female.”
Ordinal data
Is when the values assigned to each observation represent a rank, such as 1st, 2nd, or 3rd.
Nominal data
Is usually easier to work with than ordinal data because there’s no ordering involved. But sometimes, you might want to use ordinal data even though it’s more complicated.
One reason will be if you’re trying to measure how much something has changed over time. In that case, you would use ordinal data because it gives a ranking of the changes that have occurred.
So which type of data is better?
SURPRISE!
The answer is still the same. It all depends on what question you’re trying to answer!
However, it helps to always understand the difference in types of data so you can effectively analyze your data in the most efficient way possible.
Use Cases
The best way to use data is by using both quantitative and qualitative data. Quantitative data is easy to measure and analyze, while qualitative data provides insights that cannot be calculated.
By combining the two types of data, you can get a complete understanding of what’s happening in your business or research project.
Here are some examples of how to use quantitative and qualitative data together:
1) Understand customer satisfaction
You could survey customers about their experiences with your product and then analyze the results quantitatively to see how satisfied they are on average.
You could also look at comments from customers about their experiences to get a sense of what they liked/didn’t like about the product.
This would give you a complete picture of customer satisfaction than just looking at numerical results alone.
2) Evaluate the effectiveness of a new marketing campaign
You could track website visits and conversions before and after the campaign launch date.
You could also interview people who visited the website but didn’t convert to get feedback on why they didn’t make a purchase.
This would help you understand which aspects of the campaign were most effective (and which ones weren’t).
3) Scientific research
It is often helpful to combine quantitative measurements with subjective observations from experiments or interviews with study participants.
4) This allows researchers to see not only what is happening in an experiment but also why it is happening
Giving them valuable insights into their findings.As a data scientist, you know that data is essential to making informed decisions.
But what are some specific use cases where data insights can be helpful?Identifying customer trends: By analyzing past customer behavior, you can identify patterns and trends that may indicate future buying habits.
This information can help you make more informed product recommendations and marketing strategies.
5) Improving business processes
Data insights can help improve business processes by identifying inefficiencies and areas for improvement.
For example, by tracking website traffic, you may be able to determine which pages are most popular and optimize them accordingly.
6) Enhancing product development
Data analytics can play a crucial role in improving product development by providing feedback on user engagement, satisfaction, and even usability issues.
This information can help teams make better design decisions as they continue to develop their products or services.
How can you take advantage of your data?
Would you need an end-to-end vector platform that incorporates all the state-of-the-art clustering algorithms and workflows?
This is where Relevance AI comes into play.


