
D3.js
The Power of D3.js and AI Integration
D3.js and AI Agents form a powerful combination that transforms data visualization development. This synergy enables developers to create sophisticated, interactive visualizations while reducing the traditional learning curve and technical overhead. The integration spans multiple industries including finance, healthcare, and analytics, where AI Agents serve as specialized digital teammates who understand both visualization principles and domain-specific requirements.
Benefits of AI Agents for D3.js
What would have been used before AI Agents?
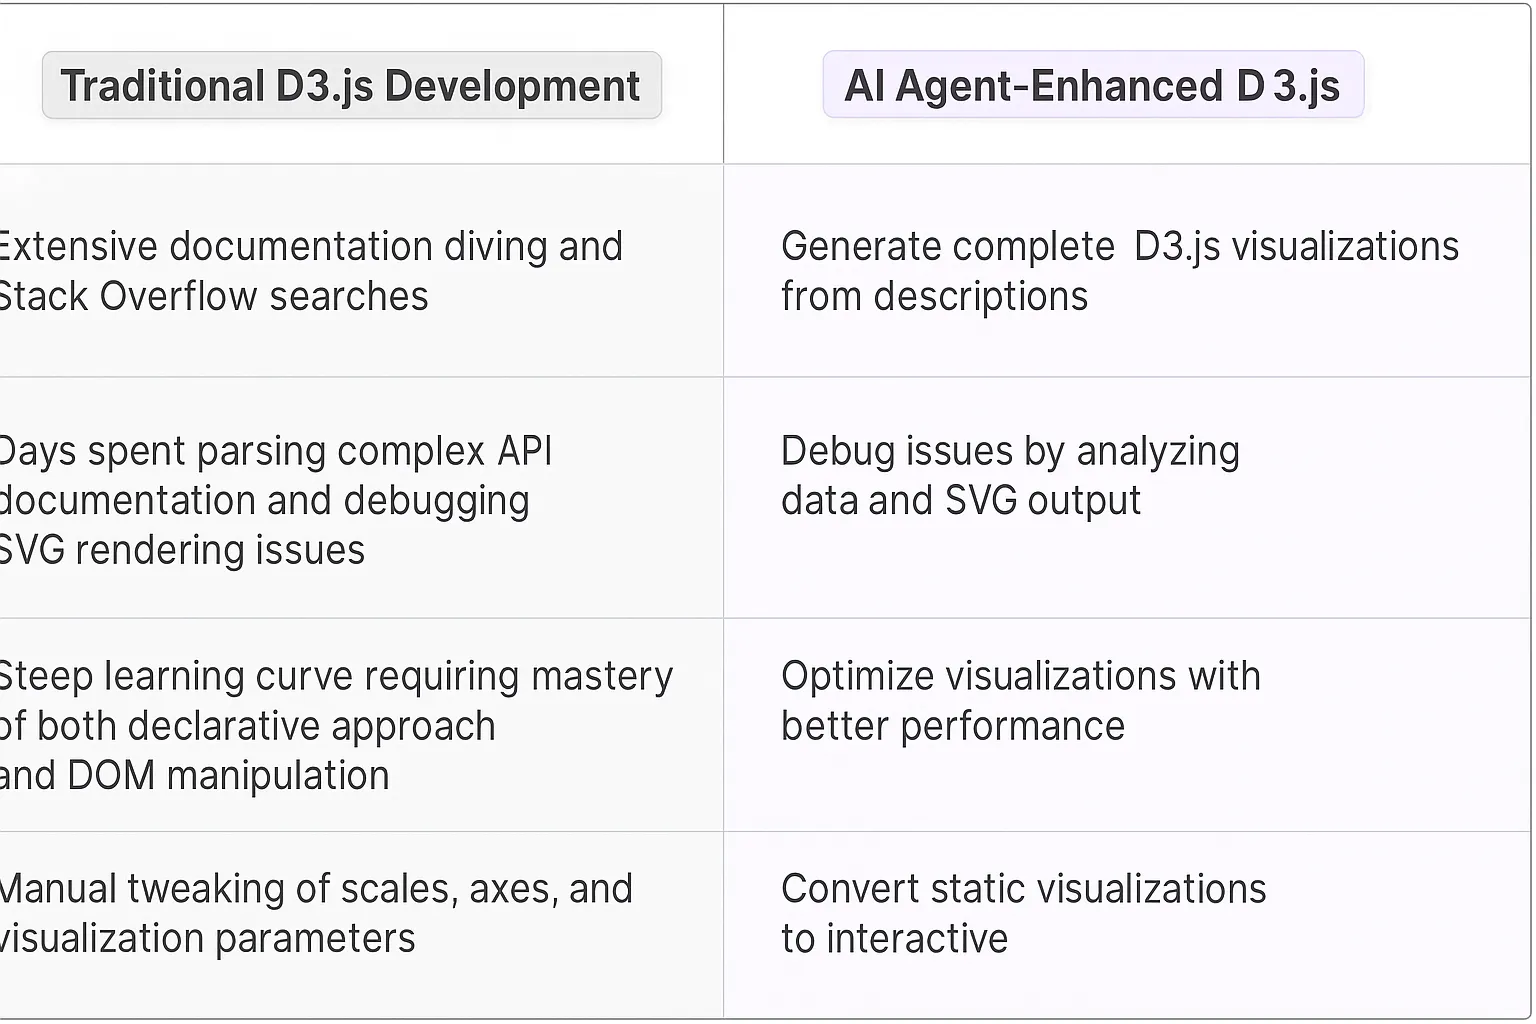
Developers working with D3.js traditionally relied on extensive documentation diving, Stack Overflow searches, and countless hours of trial and error to create data visualizations. They'd spend days parsing through complex API documentation, debugging SVG rendering issues, and manually tweaking scales and axes. The learning curve was steep - mastering D3.js meant understanding both its declarative approach and the underlying DOM manipulation principles.
What are the benefits of AI Agents?
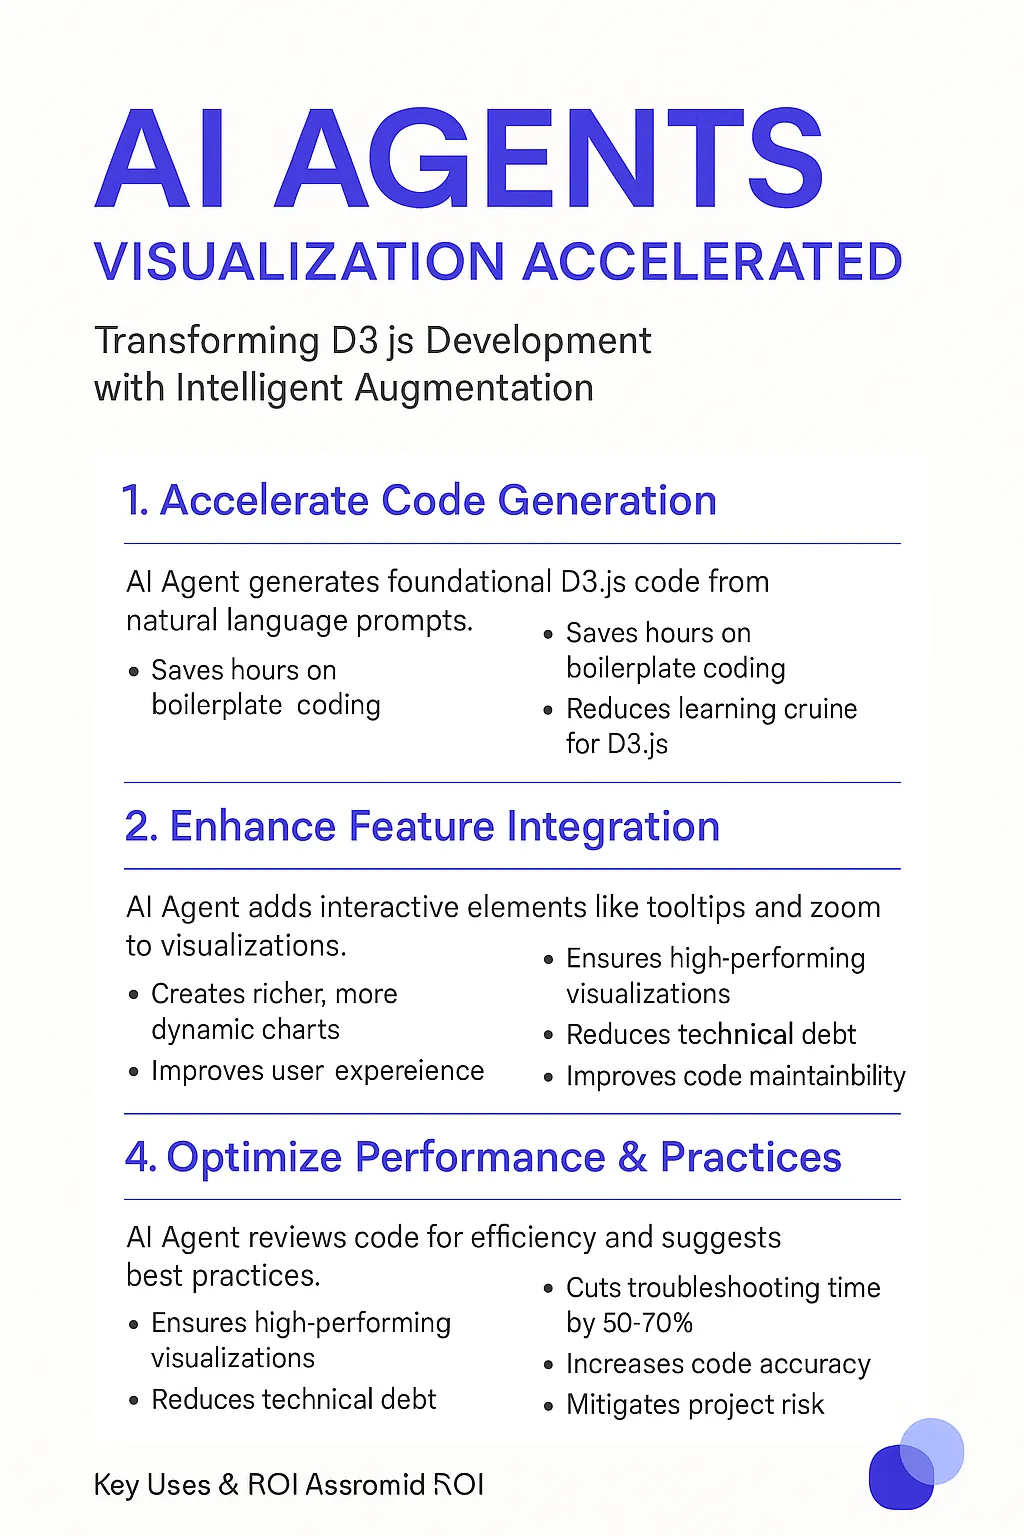
AI Agents transform the D3.js development experience by serving as expert pair programmers who deeply understand both data visualization principles and D3's technical intricacies. These digital teammates can:
- Generate complete D3.js visualization code based on natural language descriptions, eliminating the need to memorize complex API methods
- Debug rendering issues by analyzing the data structure and SVG output, identifying common pitfalls like incorrect scales or improper data binding
- Optimize existing visualizations by suggesting performance improvements and alternative approaches to data binding and transitions
- Provide contextual examples of similar visualization patterns, drawing from D3's extensive gallery of chart types and interactive features
- Convert static visualizations into interactive ones by adding appropriate event handlers and smooth transitions
- Help refactor legacy D3 code to use newer versions and more efficient patterns
The real power comes from the agents' ability to understand visualization intent. Rather than just spitting out boilerplate code, they can recommend the most effective visual encoding based on the data structure and intended message. This shifts developers from fighting with technical implementation details to focusing on creating meaningful data stories.
For teams building data-heavy applications, these AI-powered digital teammates reduce the D3.js learning curve from months to days, while simultaneously improving code quality and visualization effectiveness.
Potential Use Cases of AI Agents with D3.js
Data Visualization Creation
AI Agents can analyze datasets and automatically generate D3.js code for creating complex visualizations. When developers need to build interactive charts or graphs, the AI can suggest optimal visualization types based on the data structure and intended insights. For example, when working with time-series data, the AI can generate D3.js code for animated line charts that showcase temporal patterns and trends.
Code Optimization
D3.js code can become complex, especially when handling large datasets or creating intricate visualizations. AI Agents excel at refactoring and optimizing D3.js implementations, identifying performance bottlenecks, and suggesting more efficient approaches to data binding and DOM manipulation. They can transform verbose code into cleaner, more maintainable solutions while preserving functionality.
Interactive Dashboard Development
Building responsive dashboards with D3.js requires careful coordination of multiple visualization components. AI Agents can manage the integration of various charts, handle cross-filtering logic, and implement smooth transitions between different views. They can generate code for coordinated visualizations that respond to user interactions in real-time.
Data Processing and Transformation
Raw data often needs significant preprocessing before it can be visualized effectively with D3.js. AI Agents can handle complex data transformations, including aggregation, filtering, and restructuring. They can convert data into the optimal format for D3.js visualizations while preserving data integrity and relationships.
Animation and Transition Management
D3.js animations require precise timing and coordination of multiple elements. AI Agents can generate code for smooth transitions, managing enter/update/exit patterns, and creating engaging animated visualizations. They can handle complex animation sequences while maintaining performance and visual coherence.
Custom Visualization Design
When standard chart types aren't sufficient, AI Agents can assist in creating custom D3.js visualizations. They can generate code for specialized visual representations, handle complex geometric calculations, and implement custom interactions while following D3.js best practices and performance guidelines.
Debugging and Troubleshooting
D3.js debugging can be challenging due to its declarative nature and data-driven approach. AI Agents can analyze error patterns, suggest fixes, and help developers understand complex D3.js behaviors. They can identify common pitfalls in data binding, selection operations, and transition implementations.
Documentation Generation
AI Agents can create comprehensive documentation for D3.js visualizations, including code explanations, usage examples, and API references. They can document complex visualization logic, data requirements, and interaction patterns, making it easier for teams to maintain and extend D3.js implementations.
Industry Use Cases
D3.js data visualization projects gain remarkable depth and sophistication when paired with AI agents. These digital teammates analyze complex datasets, suggest optimal visualization approaches, and even help debug tricky D3 implementations. The combination creates powerful new possibilities for organizations working with data-heavy applications.
While traditional D3.js development requires deep expertise in both data analysis and JavaScript, AI agents bridge this knowledge gap. They serve as collaborative partners who understand data relationships, visualization best practices, and D3's extensive API. This partnership transforms how teams approach data visualization projects across multiple sectors.
The real power emerges when AI agents help tackle the nuanced challenges that come with D3.js implementations - from choosing the right scales and transitions to optimizing performance for large datasets. These digital teammates can analyze requirements, suggest visualization strategies, and even generate starter code that adheres to D3's declarative approach to DOM manipulation.
The following industry examples demonstrate how organizations leverage AI agents to enhance their D3.js visualization workflows, making complex data more accessible and actionable for their specific needs. Investment analysts and data professionals across industries are discovering new ways to unlock insights through this powerful combination.
Finance Industry: D3.js AI Agents Transform Investment Analysis
Investment analysts at major hedge funds face the daily challenge of processing vast amounts of market data to identify trading opportunities. A D3.js AI Agent acts as a specialized digital teammate that transforms complex financial datasets into interactive, real-time visualizations that reveal hidden patterns in market behavior.
When an analyst needs to evaluate a potential investment, the D3.js Agent can instantly generate custom visualizations that combine multiple data sources - stock prices, trading volumes, social sentiment, and macroeconomic indicators. The Agent adapts these visualizations on the fly based on the analyst's queries and exploration paths.
For example, when examining a tech stock's performance, the Agent might detect an interesting correlation between the company's product launch dates and unusual options trading patterns. It automatically generates an interactive scatter plot with timeline annotations, allowing the analyst to zoom into specific periods and overlay additional metrics like insider trading activity.
The real breakthrough comes from the Agent's ability to learn from how analysts interact with these visualizations. It begins to anticipate which visual perspectives will be most relevant for different types of analysis. When examining biotech stocks, it might emphasize FDA approval timelines and clinical trial data. For retail stocks, it could highlight seasonal patterns and consumer spending correlations.
This dynamic visualization capability transforms how investment teams process market intelligence. Rather than drowning in static charts and spreadsheets, analysts can have fluid conversations with their data through an AI-powered visual interface that speaks their language and adapts to their analytical workflow.
The impact on decision velocity is significant - what previously took hours of manual chart creation and data wrangling now happens in seconds through natural dialogue with an AI that deeply understands both financial data visualization and investment analysis processes.
Healthcare Analytics: D3.js AI Agents Decode Patient Outcomes
Medical researchers at leading hospitals are leveraging D3.js AI Agents to crack one of healthcare's toughest challenges - understanding complex patient outcome patterns across massive clinical datasets. These digital teammates transform raw medical data into interactive visual stories that reveal critical insights about treatment effectiveness.
The D3.js Agent serves as a specialized visualization partner for clinical research teams, ingesting diverse data sources including electronic health records, genomic profiles, treatment protocols, and recovery metrics. It generates dynamic, interactive visualizations that adapt in real-time as researchers explore different hypotheses about patient outcomes.
A powerful example emerged during a recent cancer treatment study where researchers were analyzing response rates across different demographic groups. The Agent detected subtle patterns in how specific genetic markers correlated with treatment success. It automatically generated an interactive network diagram showing these relationships, with node sizes reflecting statistical significance and colors indicating different patient cohorts.
The Agent's deep learning capabilities mean it gets smarter with each research project. It learns which visual formats best communicate different types of medical insights - using survival curves for longitudinal studies, heat maps for genomic data, and force-directed graphs for showing treatment pathway relationships. The visualizations become increasingly sophisticated as the Agent builds understanding of medical domain knowledge.
Beyond just creating charts, the Agent acts as a collaborative partner in the research process. When it spots an unusual pattern in the data, it proactively suggests relevant visualization angles to help researchers investigate further. This might mean automatically generating comparative views across different patient subgroups or overlaying multiple data dimensions to reveal hidden correlations.
The result is a fundamental shift in how medical research teams interact with their data. Rather than spending weeks manually creating visualizations, researchers can explore complex clinical datasets through an AI-powered visual interface that speaks their language and surfaces meaningful patterns that drive better patient care.
Considerations and Challenges
Building AI agents for D3.js data visualization requires navigating complex technical territory while maintaining an intuitive user experience. The intersection of machine learning and interactive data visualization presents unique obstacles that teams need to carefully evaluate.
Technical Challenges
D3.js's declarative approach to DOM manipulation can clash with AI agent processing patterns. The core challenge lies in synchronizing the agent's real-time data analysis with D3's enter-update-exit pattern. Teams often struggle with handling state management when the AI agent needs to modify visualizations based on dynamic user interactions.
Memory management becomes critical as D3 selections and data bindings accumulate. AI agents processing large datasets while maintaining smooth transitions and animations can quickly strain browser resources. Implementing efficient garbage collection and data structure optimization requires careful architectural planning.
Operational Challenges
Training AI agents to understand visualization context demands extensive domain expertise. The agent needs to grasp both statistical principles and design fundamentals to generate meaningful D3 visualizations. This dual requirement often creates a talent bottleneck for teams.
Version compatibility between D3's frequent updates and AI model deployments requires constant monitoring. Breaking changes in either system can disrupt visualization rendering or agent behavior. Teams need robust testing frameworks to catch regression issues early.
Integration Considerations
API design patterns must account for both synchronous D3 operations and asynchronous AI processing. Teams should implement proper error boundaries and fallback states for when AI suggestions fail or produce unexpected results. Clear separation of concerns between visualization logic and AI processing helps maintain code maintainability.
Browser performance optimization becomes crucial when running AI models alongside D3 animations. Techniques like web workers for AI processing and virtual DOM diffing for updates help maintain smooth user experiences. Teams should implement progressive enhancement to ensure basic visualization functionality even when AI features are unavailable.
The Future of Data Visualization: D3.js and AI Integration
The fusion of D3.js with AI Agents marks a significant evolution in data visualization development. These digital teammates eliminate traditional barriers to entry while enhancing the sophistication of what developers can create. As organizations continue adopting this technology combination, we're seeing faster development cycles, more intuitive visualizations, and deeper insights from complex datasets. The next wave of data visualization tools will likely build upon this foundation, further bridging the gap between raw data and meaningful visual stories.


