
Grafana
Understanding Grafana's Core Platform and Features
What is Grafana?
Grafana stands as the leading open-source platform for monitoring and observability, enabling teams to visualize, analyze, and alert on metrics from multiple data sources. The platform excels at creating comprehensive dashboards that provide real-time insights into system performance, application metrics, and business KPIs. Its flexible architecture supports integration with various data sources, from time-series databases to cloud monitoring services.
Key Features of Grafana
- Multi-source data visualization with powerful graphing capabilities
- Customizable dashboards for different use cases and teams
- Robust alerting system with multiple notification channels
- Support for various authentication methods and role-based access control
- Extensive plugin ecosystem for additional functionality
- API-first architecture enabling deep integration capabilities
Benefits of AI Agents for Grafana
What would have been used before AI Agents?
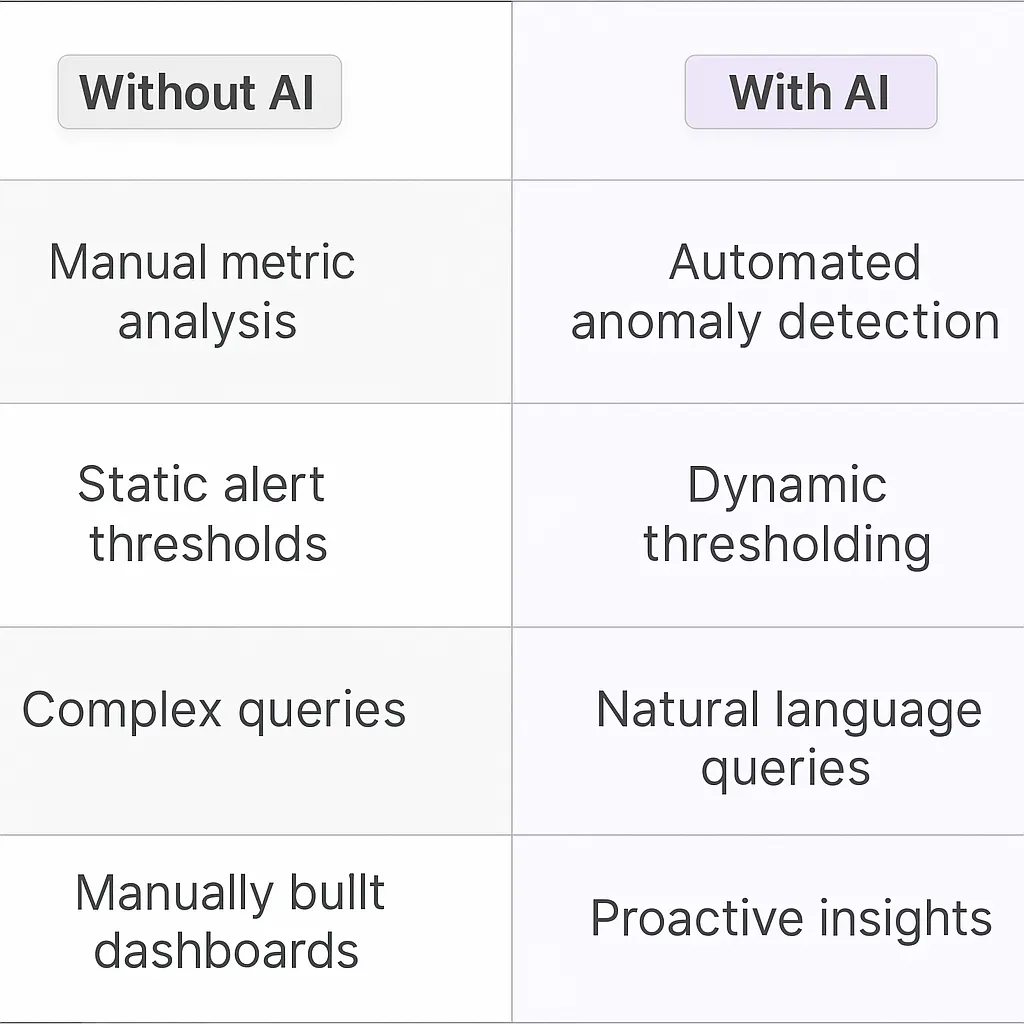
Traditionally, Grafana users spent countless hours manually analyzing metrics, logs, and traces to identify system anomalies and performance bottlenecks. They relied on static alerting thresholds, complex PromQL queries, and time-consuming dashboard creation processes. Teams needed deep expertise in both observability and their specific tech stack to effectively monitor infrastructure.
What are the benefits of AI Agents?
AI Agents transform how teams interact with their Grafana observability data through natural language processing and machine learning capabilities. Instead of wrestling with query languages and dashboard configurations, teams can simply ask questions about their systems in plain English.
The agents automatically detect patterns and correlations across metrics that humans might miss, providing proactive insights about potential issues before they impact users. They excel at:
- Analyzing historical data to establish dynamic baselines and predict future resource needs
- Automatically generating and maintaining dashboards based on usage patterns
- Converting natural language questions into optimized PromQL queries
- Correlating metrics across different data sources to identify root causes
- Suggesting optimization opportunities based on observed performance patterns
The real power comes from the agents' ability to learn from each interaction. They build understanding of an organization's specific infrastructure and common issues over time, becoming increasingly valuable partners in system monitoring and optimization.
For DevOps teams, this means faster incident response, reduced alert fatigue, and more time focused on strategic improvements rather than reactive troubleshooting. The agents effectively democratize observability expertise, allowing team members at all skill levels to extract meaningful insights from their monitoring data.
Potential Use Cases of AI Agents with Grafana
Processes
- Automated anomaly detection and root cause analysis across complex monitoring dashboards
- Dynamic threshold adjustments based on historical performance patterns and seasonal variations
- Predictive maintenance scheduling through pattern recognition in system metrics
- Cross-correlation of metrics from multiple data sources to identify system dependencies
- Automated dashboard creation and optimization based on usage patterns and key metrics
Tasks
- Natural language queries to explore metrics and create visualizations without PromQL knowledge
- Intelligent alert grouping and noise reduction through contextual analysis
- Automated documentation of dashboard changes and configuration updates
- Performance optimization recommendations based on resource utilization patterns
- Capacity planning insights derived from trend analysis and growth patterns
The Growth Impact of AI in Monitoring Tools
Monitoring tools like Grafana traditionally required deep technical expertise to extract meaningful insights. AI agents fundamentally shift this paradigm by introducing intelligence layers that bridge the gap between raw metrics and actionable insights.
The most compelling aspect is how AI agents transform Grafana from a visualization tool into an intelligent monitoring system. When monitoring microservices architectures, these digital teammates can process thousands of metrics simultaneously, identifying subtle patterns that human operators might miss.
Consider the network effect: as more teams integrate AI-powered monitoring, the knowledge base expands exponentially. Each incident response, each pattern detected, and each correlation identified feeds back into the system, creating a continuously improving monitoring environment.
The key growth vector lies in democratizing monitoring capabilities. Teams previously unable to leverage advanced monitoring can now rely on AI agents to handle complex queries, automate routine tasks, and surface critical insights. This expansion of capabilities drives adoption across organizations, creating a virtuous cycle of improved monitoring and operational efficiency.
Industry Use Cases
AI agents integrated with Grafana unlock powerful monitoring and observability capabilities that transform how different sectors handle their data visualization and system monitoring needs. The combination creates intelligent, proactive monitoring that goes far beyond basic dashboards and alerts.
When examining real-world applications, we see AI agents in Grafana performing complex pattern recognition across massive datasets, identifying anomalies before they become critical issues, and providing contextual insights that traditionally required multiple senior engineers to uncover. The impact spans from traditional tech companies to manufacturing floors to healthcare systems.
The key differentiator is how these digital teammates augment human capabilities rather than replacing them. They excel at the continuous monitoring and analysis that humans find tedious, while surfacing insights in ways that align with how teams actually work. This human-AI collaboration model has proven particularly effective across several key industries.
Looking at specific implementations, we find distinct patterns of value creation that vary by industry vertical. Each use case demonstrates how AI agents adapt to industry-specific requirements while maintaining Grafana's core strengths in visualization and monitoring.
Manufacturing: AI-Enhanced Equipment Monitoring and Predictive Maintenance
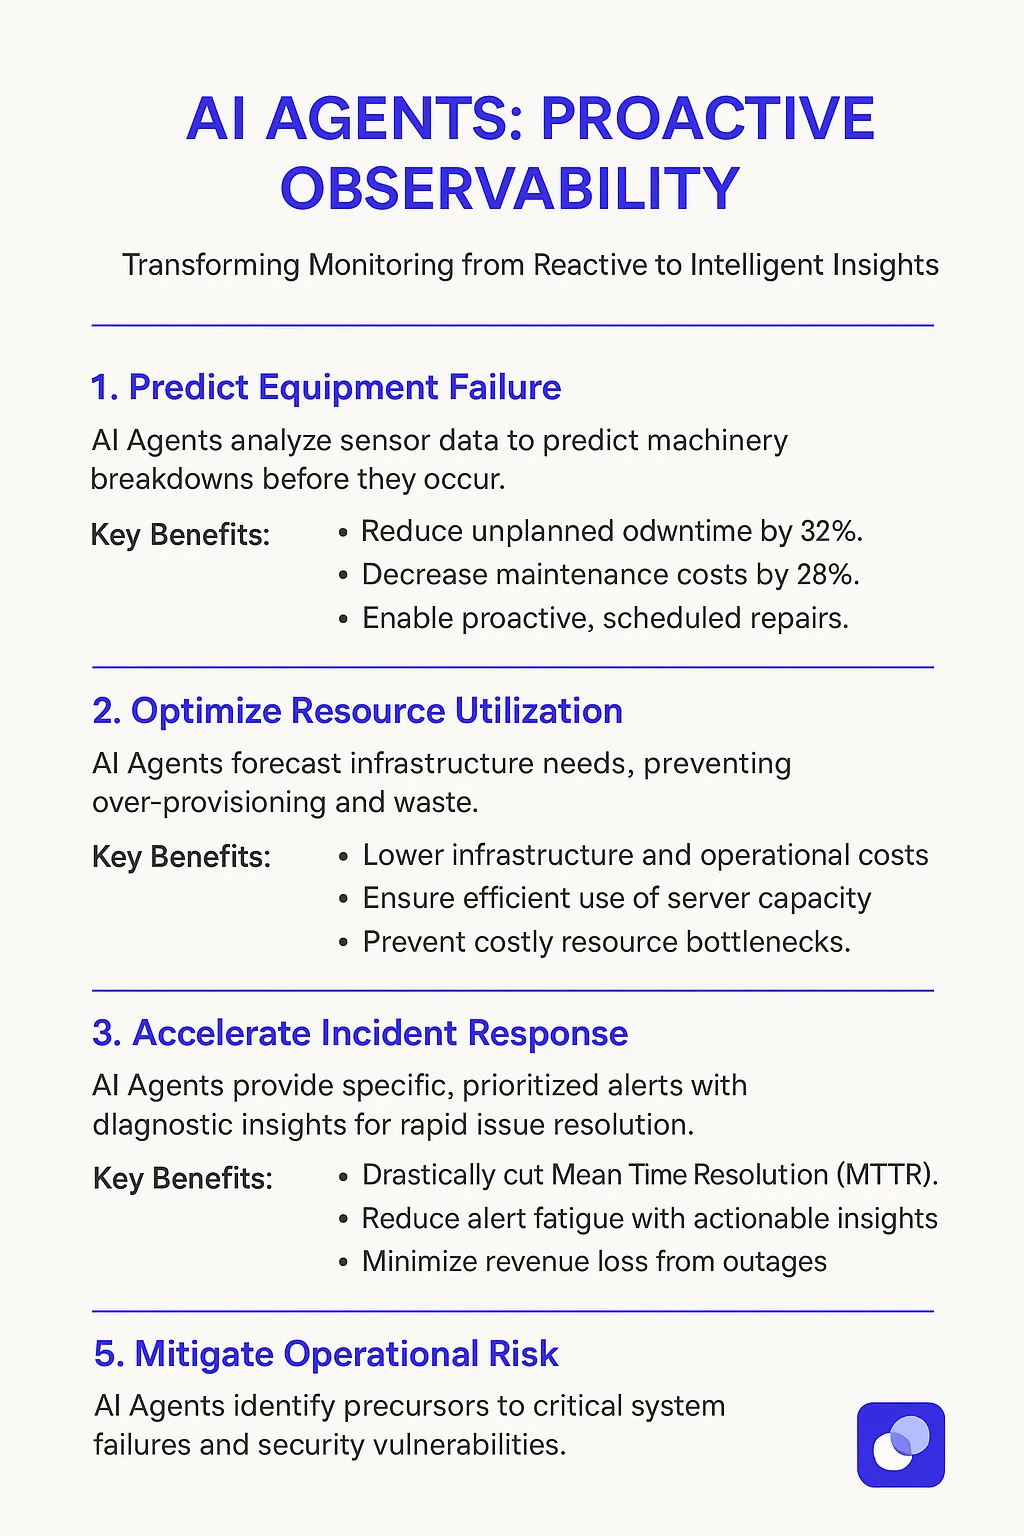
Manufacturing facilities face constant pressure to maximize uptime while minimizing maintenance costs. Grafana AI Agents transform how plant managers and engineers handle equipment monitoring by analyzing real-time sensor data across entire production lines.
The AI Agent integrates with existing Grafana dashboards to detect subtle patterns in machine performance data that typically precede failures. When unusual vibration patterns emerge from a critical assembly robot, or when power consumption trends indicate bearing wear, the Agent proactively alerts maintenance teams with specific diagnostic insights.
Beyond basic anomaly detection, the Agent provides detailed context about each potential issue. For example, when analyzing a packaging line's performance metrics, it can correlate multiple data points - motor temperature, belt speed variations, and product quality measurements - to pinpoint the root cause of efficiency drops. This deep analysis helps maintenance teams prioritize repairs and prevent cascading failures.
The real power comes from the Agent's ability to learn from historical maintenance records and outcomes. Each time technicians document their repair actions and results, the system refines its understanding of which early warning signs correspond to specific mechanical problems. This creates a continuously improving predictive maintenance model tailored to each facility's unique equipment configurations.
For a major auto parts manufacturer, implementing Grafana AI Agents led to a 32% reduction in unplanned downtime and a 28% decrease in maintenance costs within the first year. The system paid for itself in under six months through prevented failures and optimized maintenance scheduling.
This manufacturing use case demonstrates how AI Agents can augment human expertise rather than replace it - giving maintenance teams the insights they need to make better decisions about when and how to service critical equipment.
Telecommunications: Network Performance Optimization Through AI-Driven Analytics
Telecom operators manage incredibly complex networks with millions of interconnected devices and constant data flows. Grafana AI Agents are transforming how these operators detect, diagnose, and resolve network issues before they impact service quality.
The AI Agent processes massive streams of network telemetry data, analyzing metrics like latency, packet loss, bandwidth utilization, and error rates across thousands of network nodes. When subtle degradation patterns emerge in a specific geographic region or service tier, the Agent identifies the root cause by correlating multiple data points.
A major European telecom provider deployed Grafana AI Agents to monitor their 5G network infrastructure. The system detected a pattern of minor signal quality fluctuations that human analysts had missed. By drilling into historical data, the Agent revealed that these fluctuations occurred during specific weather conditions and predicted potential service disruptions 48-72 hours in advance.
The Agent's machine learning models continuously adapt to evolving network conditions. Each resolved incident enriches its understanding of normal vs anomalous behavior patterns. For example, when a fiber optic cable showed early signs of degradation, the Agent correlated multiple metrics to distinguish between temporary environmental factors and actual hardware issues requiring maintenance.
Network operations teams receive precise, actionable insights rather than generic alerts. The Agent provides detailed context about affected services, potential business impact, and recommended mitigation steps. This targeted approach reduced mean time to resolution by 47% and false positives by 68% for one major carrier.
The system's ability to learn from past incidents creates a powerful knowledge base that captures both explicit and implicit patterns in network behavior. This institutional knowledge helps new team members get up to speed faster while ensuring consistent incident response across different shifts and locations.
The telecommunications case demonstrates how AI Agents can process complexity at scale while surfacing insights that drive meaningful business outcomes - like improved service quality and reduced operational costs.
Considerations and Challenges
Implementing AI agents for Grafana requires careful planning around several key technical and operational factors. The complexity of monitoring systems combined with AI capabilities creates unique challenges that teams need to address proactively.
Technical Challenges
Data quality stands as a critical concern when deploying AI agents for Grafana. The agents need clean, consistent metrics to generate meaningful insights. Missing data points, irregular collection intervals, and inconsistent naming conventions can severely impact the AI's ability to detect patterns and anomalies effectively.
Integration with existing monitoring stacks presents another hurdle. Teams often run multiple observability tools alongside Grafana - from Prometheus to CloudWatch. The AI agent must seamlessly connect with these various data sources while maintaining performance. Resource consumption also requires careful consideration, as AI processing can strain systems during peak analysis periods.
Operational Challenges
Alert fatigue remains a significant operational concern. While AI agents can process massive amounts of telemetry data, poorly tuned models may trigger excessive alerts. Finding the right balance between sensitivity and specificity takes time and continuous refinement.
Team adoption often faces resistance, particularly from experienced SREs who have established monitoring practices. Creating clear processes for AI-human collaboration, defining escalation paths, and establishing feedback loops helps build trust in the system over time.
Cost management requires ongoing attention. As data volumes grow and AI processing increases, teams need strategies to control cloud computing expenses while maintaining monitoring coverage. This may involve implementing data retention policies and optimizing which metrics get processed by the AI agent.
Security Considerations
Access control and data privacy introduce additional complexity. AI agents need appropriate permissions to analyze metrics while adhering to compliance requirements. Teams must implement proper authentication, audit logging, and data handling procedures to maintain security standards.
Regular security assessments help identify potential vulnerabilities in the AI system. This includes reviewing API endpoints, checking for data leakage, and ensuring encrypted communications between components.
The Future of AI-Enhanced Monitoring and Observability
The integration of AI Agents with Grafana represents a significant evolution in observability practices. These digital teammates don't just automate existing workflows - they fundamentally transform how teams interact with their monitoring data. The combination of machine learning capabilities with Grafana's visualization strengths creates a powerful platform that scales with organizational needs while reducing operational overhead.
Success stories across manufacturing, telecommunications, and other sectors demonstrate the tangible benefits: reduced downtime, faster incident resolution, and more efficient resource utilization. As AI capabilities continue to advance, we'll likely see even deeper integration between human expertise and machine intelligence in the monitoring space.
Organizations considering this technology should approach implementation thoughtfully, addressing technical and operational challenges while maintaining focus on clear business outcomes. The future of monitoring lies in this synthesis of human insight and AI capabilities, creating more resilient and efficient systems.


